
Homepage Layout Refresh & New "MMM %" Card
Homepage Layout Refresh & New "MMM %" Card
Buckle up! Your homepage got a refresh, and we think you're going to love it.
First, we've brought the Halo Effects card to the top of the screen. Halo Effects validate your top of funnel marketing budget and give you a quick sneak peak at which channels are driving the best awareness, and which are driving the most conversion, across all your web stores! Check out more about the new Halo Effect card below
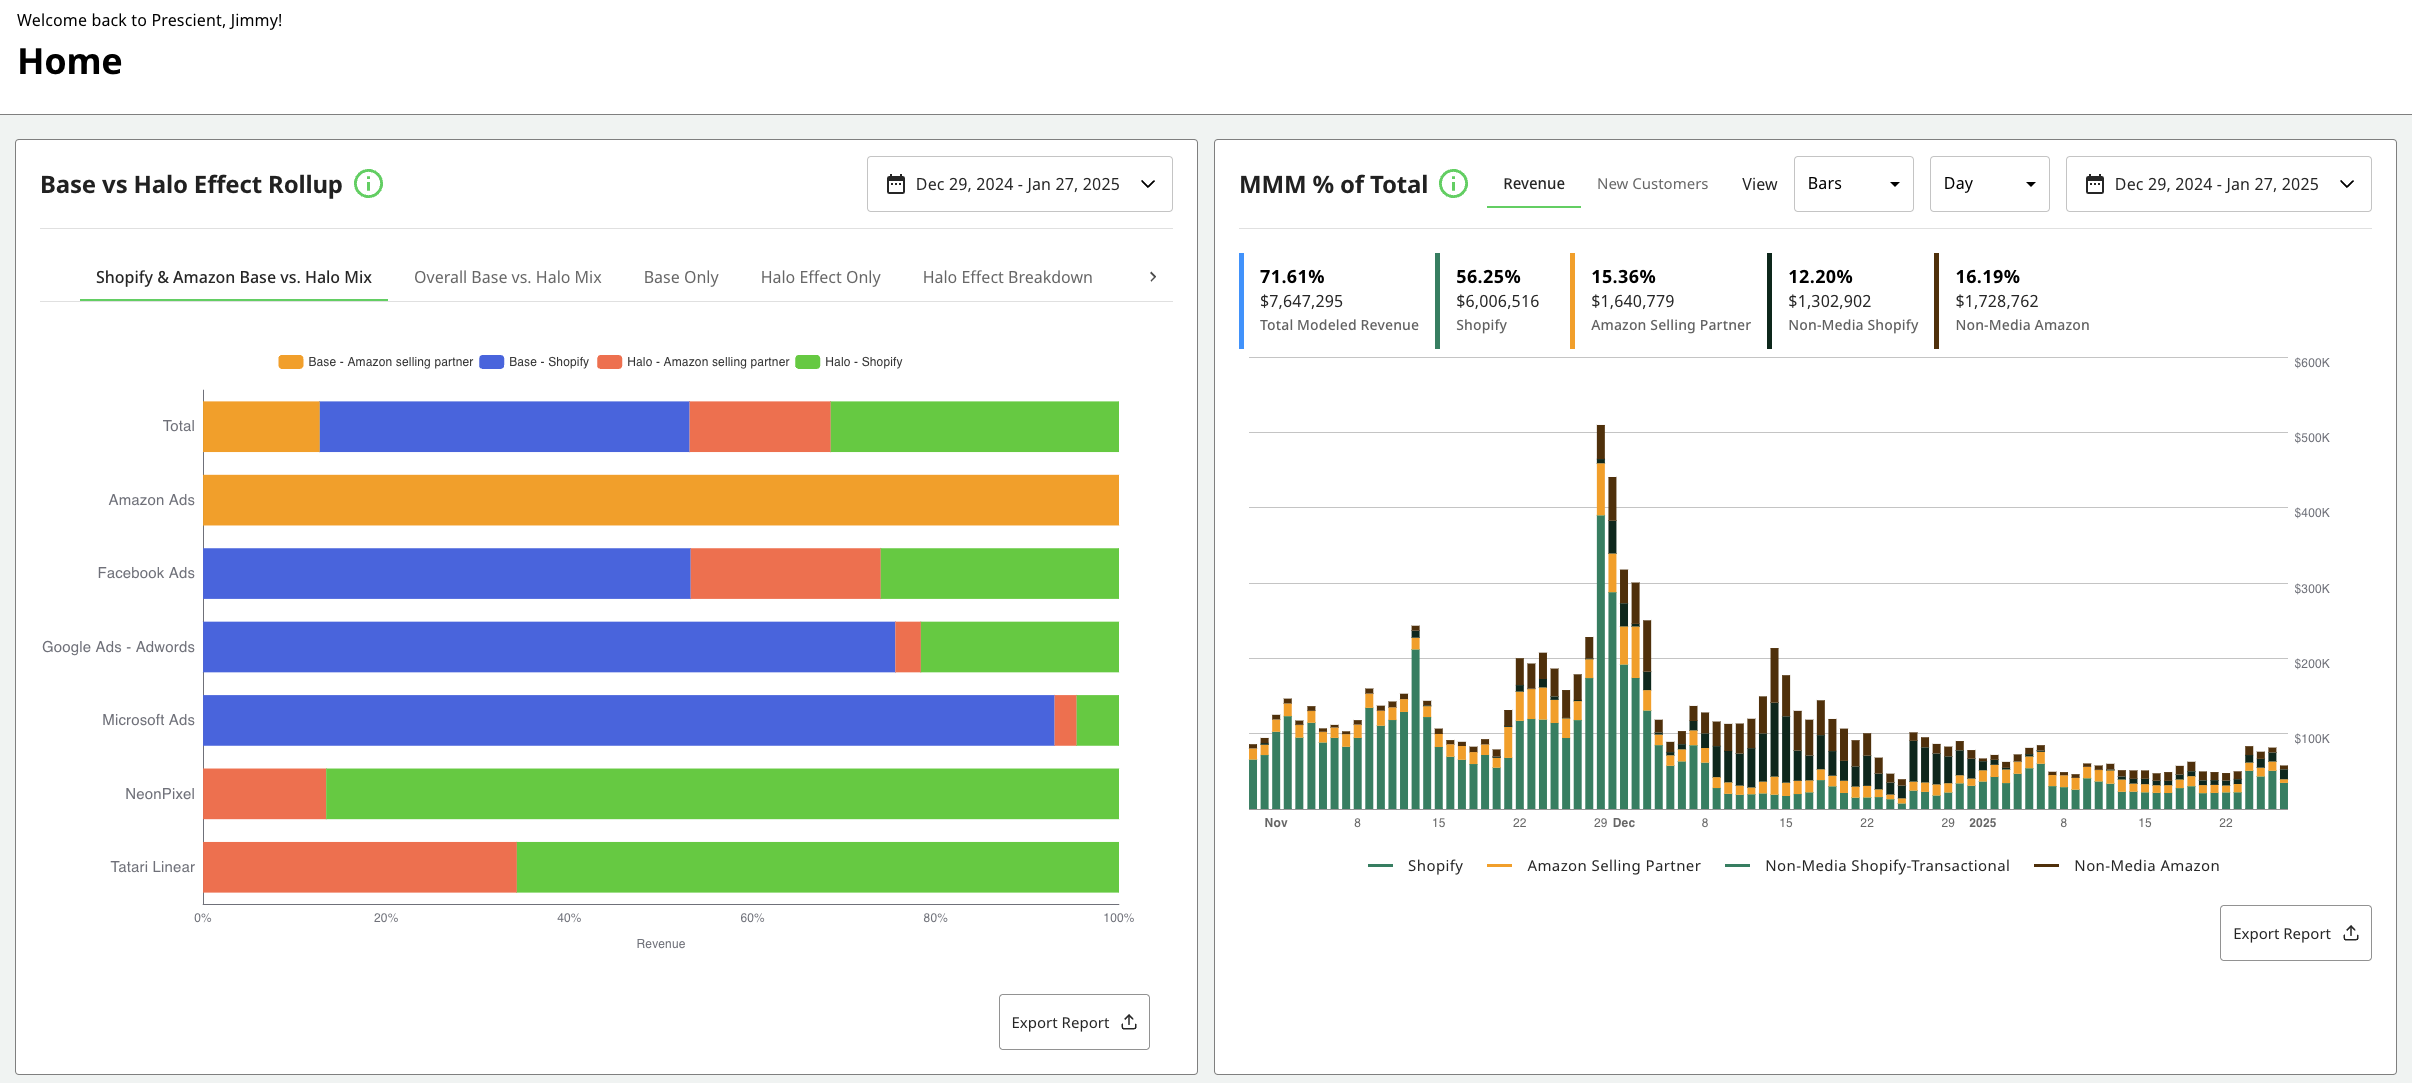
Your home page is getting a new card called "MMM %" as well. Let's dive in there.
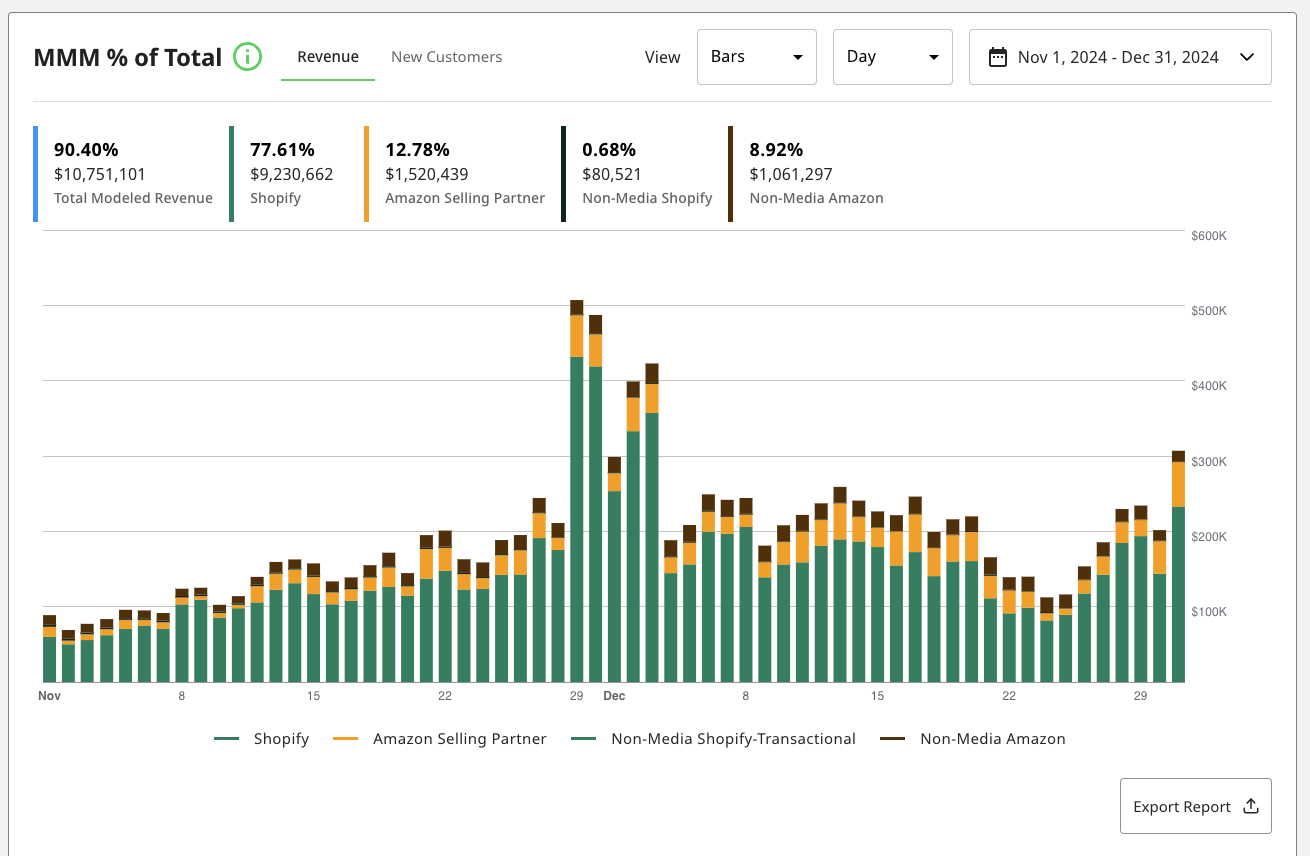
Understanding the legend
each key can apply to Revenue or New Customers depending on the user selection at the top of the chart — defaulting to Revenue:
NOTE -- "DTC" below will refer to whichever primary ecommerce web store data you are using, e.g. Shopify, BigCommerce, GA4, etc.
- Total Modeled: this is the % or absolute # of Revenue or New Customers that our models say were driven by your paid media efforts compared to the total number across all your stores (e.g.
DTC+ Amazon)
In the example above you'll see that between Nov - Dec, we modeled that 90.4% of this brand'sTotal Revenue was driven by their paid media. DTC/ Amazon Selling Partner: this tells you the % of revenue or new customers observed on the named web store (e.g. Shopify, Amazon) that came from media.
In the example above you'll see that between Nov - Dec, we modeled that 77.6% of this brand'sShopify Revenue and 12.8% of Amazon Revenue was driven by their paid media. Note that:- "DTC + Amazon Selling Partner" = "Total Modeled Revenue"
- 12.8% (Amazon) + 77.6% (Shopify) = 90.4% (Total Revenue) in this case.
- Non-Media
DTC/ Amazon: This explains revenue that was either non-measured through the Prescient model, or can otherwise be considered "word of mouth" attribution. Mathematically it is the difference between what was driving by media to your Shopify and what is not.
Note that:- "Non-Media DTC + Non-Media Amazon" = "100% - Total Modeled Revenue"
- Example above:
0.68% (Non-Media Shopify) + 8.92% (Non-Media Amazon) = 9.6% 100% - 90.4%(total modeled) = 9.6%
How to derive value from this chart
Users should use this card to quickly understand where their media is driving the most value. High areas of non-media revenue (or new customers) are a sign that there was some other activity driving your conversions. These can include but are not limited to the following:
- On site promotions
- New product launches
- Brand specific events/holidays
- Offline media activations not measured on Prescient (e.g. morning news spotlight)
- Word of mouth sales