
New Homepage
Unlock new possibilities and enhance your workflow on Prescient AI with our new Homepage dashboard experience.
Introduction
Our Product team at Prescient AI is constantly listening to our users for feedback, and iterating on their ideas to bring valuable features and functionality to the platform that makes their life easier. The new Homepage dashboard is a perfect example of that product development cycle as we heard from users that they need easy to use, out of the box, aggregated reports to quickly diagnose what's going on with their business before they navigate to more granular results on the Performance Page or engage with the Optimizer.
This new feature was developed to replace what was previously known as "Dashboard" in the top navigation. The new homepage dashboard is comprised of three reports that users asked us directly for: Key KPIs, Trends, Base & Halo Rollup, and Goals. We'll tour each of these reports in depth in this article.
Key Benefits
Our goal with this new feature was to give users a snapshot of the most important aspects of their business, so that they can decide where next to navigate in the platform and start taking action. With that in mind, here are the direct ways in which these new reports will benefit you as a user:
KPI Performance: Gives user insight into overall business performance at a glance, charts metrics over time, and splits out MMM metrics between Total, Shopify/SFCC, and Amazon.
Trends: This benefits users by giving them a more compact comparison report across their hero metrics and further split by channels. The addition of spark lines and percent changes in green, red, or black should help users spot where a trend may need to be optimized or diagnosed further.
Base vs Halo Effect Rollup: Users love the granularity of our base and halo effect reporting at the campaign level on the performance page, however, they wish to know the overall mix of base-to-halo across their business so they can understand the impact, for example, that CTV has on downstream conversions.
How it Works
All users have access to the Homepage, and it is where you'll be redirected upon login, here's a quick overview and then we will dive into each report individually:
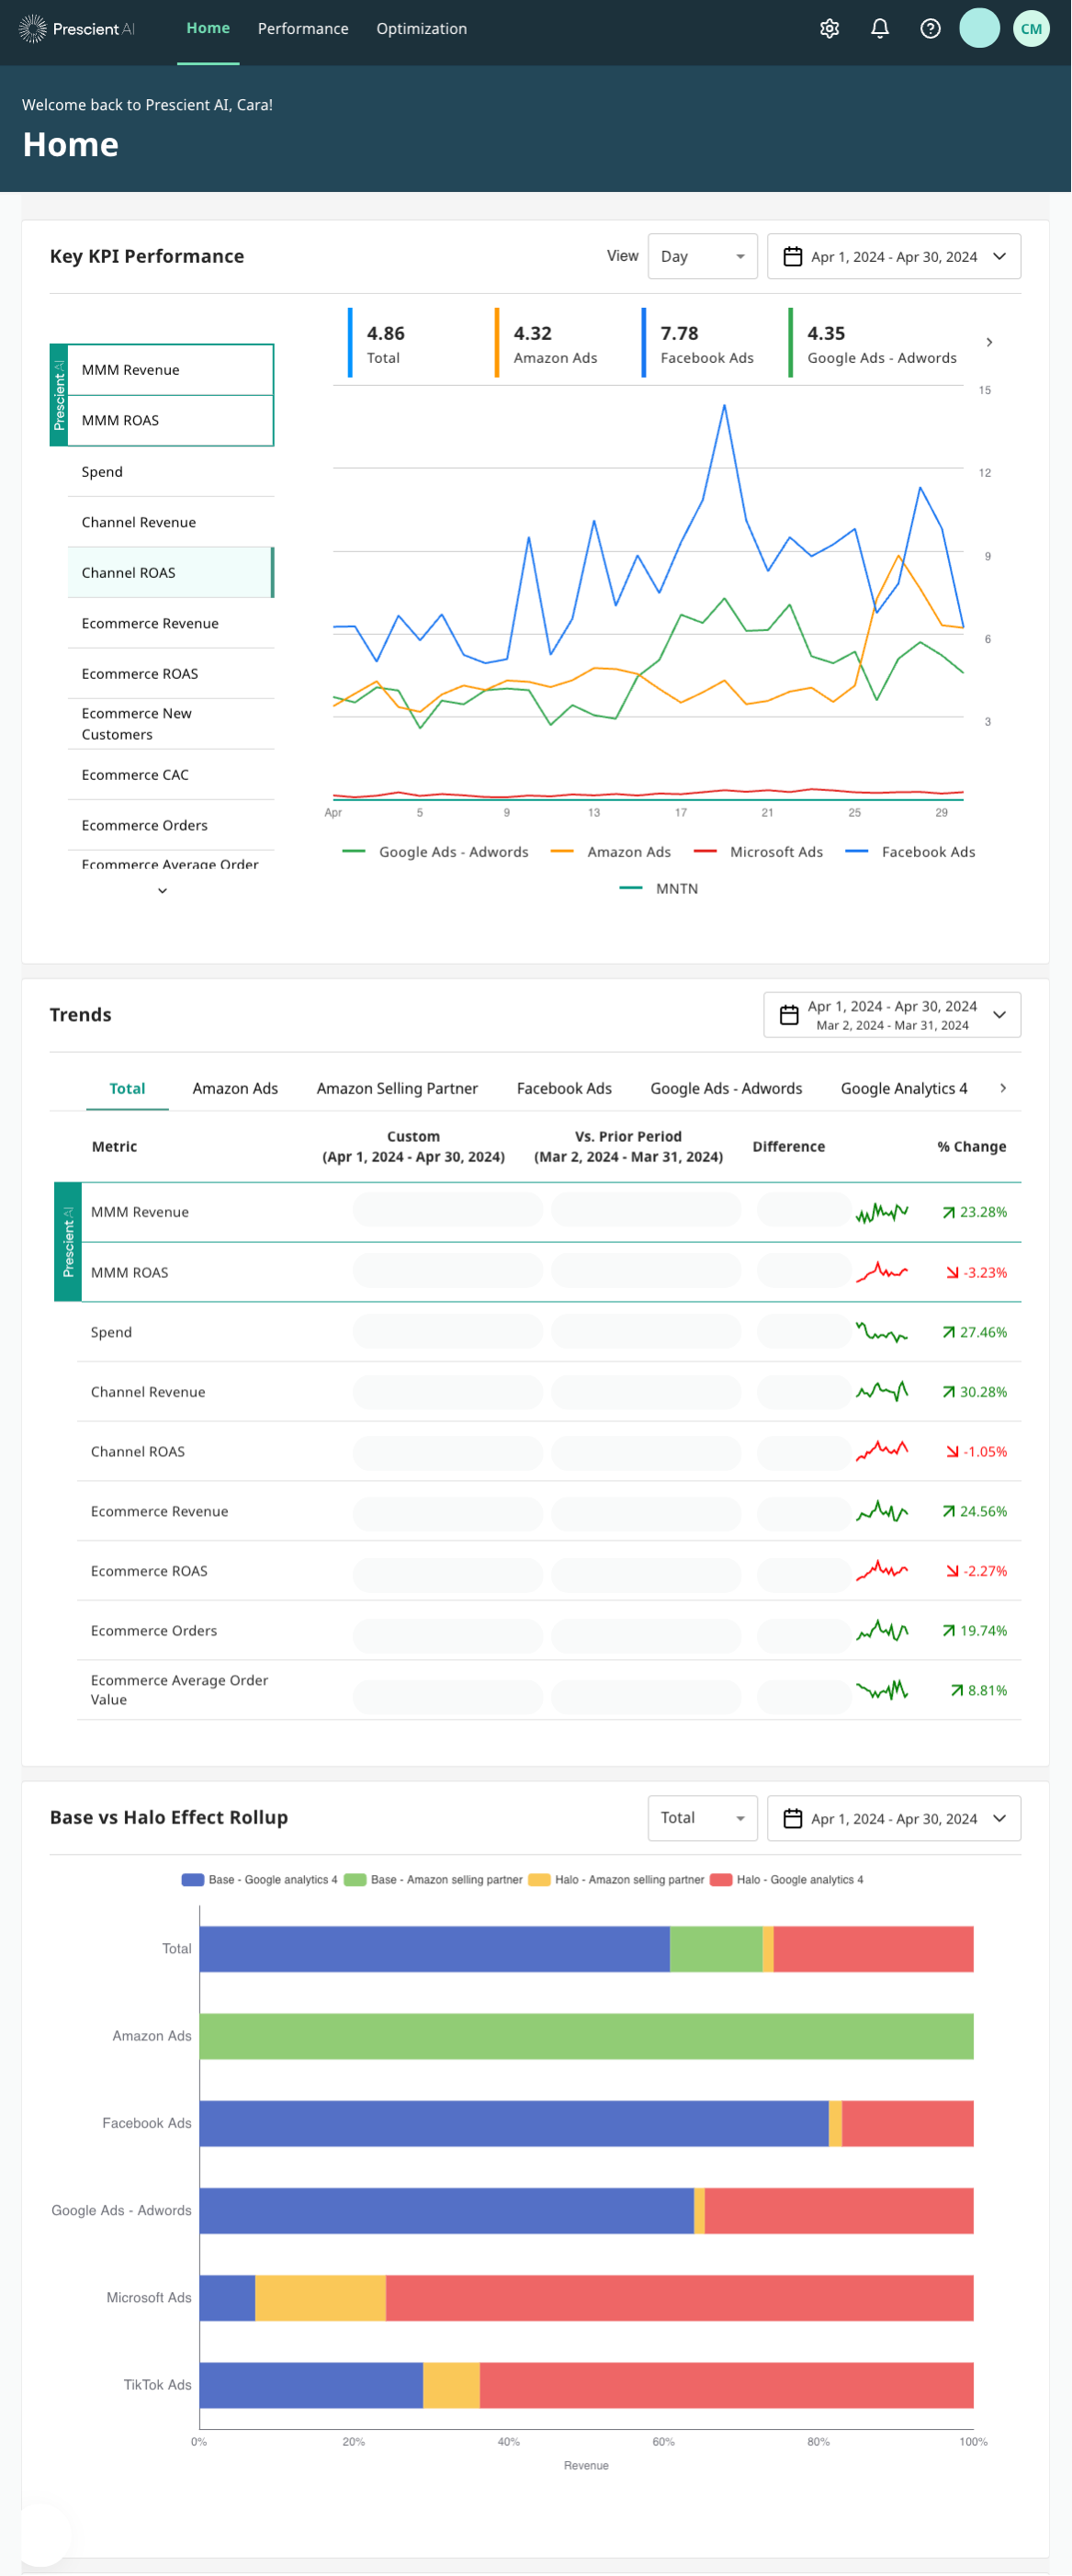
Let's dive into each of the cards to look at the features and functionality:
KPI Performance
The first report you'll encounter on the homepage is the Key KPI performance card. We have aggregated all the most important metrics to your business in a scrollable menu on the left side of the card. Additionally, you can split the MMM metrics by Total, or the contribution from each Shopify/SFCC or Amazon if you have it configured. Finally, use compare mode to understand the time series implications of performance across these metrics.
Any users such as CMO, VP, Channel Manager, or Analyst could benefit from this aggregated report as their first step into understanding MMM results. Users told us that this type of report could replace what is currently manually configured and ran for executive Monday morning briefings.

Trends
This card defaults to the last 30 days versus the prior 30 days, but can easily be configured in the date dropdown. Each of the key metrics is listed in the left column of the table, and the comparison of those metrics are in the columns to the right. Use the spark lines and color coordinated metrics to spot check how trends are moving. Finally scroll horizontally through channels and transaction providers to understand Trends at the channel level.
Any user can benefit from using the trends card, but we imagine specifically Channel managers would benefit by having the ability to dig into their channel specifically to diagnose trends.

Base vs Halo Effect Rollup
Here, users can easily see the mix of base revenue to halo effect revenue at the Total level, and across each channel within their business. User can configure different time frames to understand where and when they might have been leaning into Amazon Ads, did it have a greater impact on Halo effects?
All levels of users will also benefit from this rollup to understand the impact media has on other channels, and the implications of changing the media mix.

Conclusion
We hope that this guide helps you understand the context as to why we built this new dashboard and the benefits it will provide so that you can hit the ground running. Stay tuned for additional reports and feature updates that we will add to this experience!