
Attribution
Understand how media contributes to business performance
The Attribution page shows how Prescient’s models distribute performance across your media mix for any target type.
Use it to:
- Compare modeled results with channel-reported results
- Understand direct and cross-channel impact
- Review performance by channel, tactic, or campaign
- Analyze how attribution changes over time
- Find room for scaling based on historical data points turned into saturation plots.
1. Select Your View
Use the filters at the top of the page to choose:

- Target: Revenue, New Customers, or any enabled Modeled target.
- Model: One, many, or all applicable models
- Channels: All channels or a selected group
- Date range: The period you want to analyze
- Views: Save your filters and results for quick access
*These filters apply across the page.
2. Performance Summary
The Performance Summary provides a high-level overview of the selected date range. The metrics displayed vary depending on the selected Target (e.g., Revenue or New Customers, other targets).
→ Revenue Target

Spend
Displays the total media spend for the selected period.
It includes:
- Daily Average: Average spend per day.
- Channels: Number of channels included.
MMM Revenue
MMM Revenue is Prescient’s estimate of the incremental revenue associated with media.
It includes:
- Base Revenue: More direct media contribution
- Halo Revenue: Revenue influenced across another channel, retailer, or model
- Channel Revenue: Revenue attributed directly to marketing channels.
MMM Revenue %
The percentage of total revenue attributed by the Marketing Mix Model (MMM).
It includes:
- Base %: Percentage from direct media contribution.
- Halo %: Percentage from indirect media effects.
- Channel Revenue %: Percentage attributed directly to marketing channels.
MMM ROAS
MMM ROAS compares modeled incremental revenue with media spend.
It may differ from channel-reported ROAS because advertising platforms and Prescient use different attribution methods.
It includes:
- Base ROAS: ROAS from direct media contribution.
- Halo ROAS: ROAS from indirect media effects.
- Channel ROAS: ROAS based on channel-attributed revenue.
→ New Customers Target

Spend
Displays the total media spend for the selected period.
It includes:
- Daily Average: Average spend per day.
- Channels: Number of channels included.
Reported New Customers
New customers reported directly by advertising platforms.
- Daily Average: Average new customers per day.
- Channels: Number of reporting channels.
MMM New Customers
Prescient's estimate of the incremental new customers generated by media.
It includes:
- Base: New customers directly attributed to media.
- Halo: New customers influenced through indirect media effects.
MMM New Customers %
The percentage of total new customers attributed by the Marketing Mix Model (MMM).
It includes:
- Base %: Percentage from direct media contribution.
- Halo %: Percentage from indirect media effects.
MMM CAC
MMM Customer Acquisition Cost (CAC) measures the average media cost to acquire a modeled new customer.
It includes:
- Base CAC: Cost per directly attributed new customer.
- Halo CAC: Cost per indirectly influenced new customer.
3. Attribution Over Time
The Attribution Over Time chart shows how selected metrics change over the selected date range, helping you identify trends and understand how media performance evolves over time.
→ Compare View
It lets you compare two metrics across the selected period to help identify trends and understand how marketing activity relates to business outcomes.
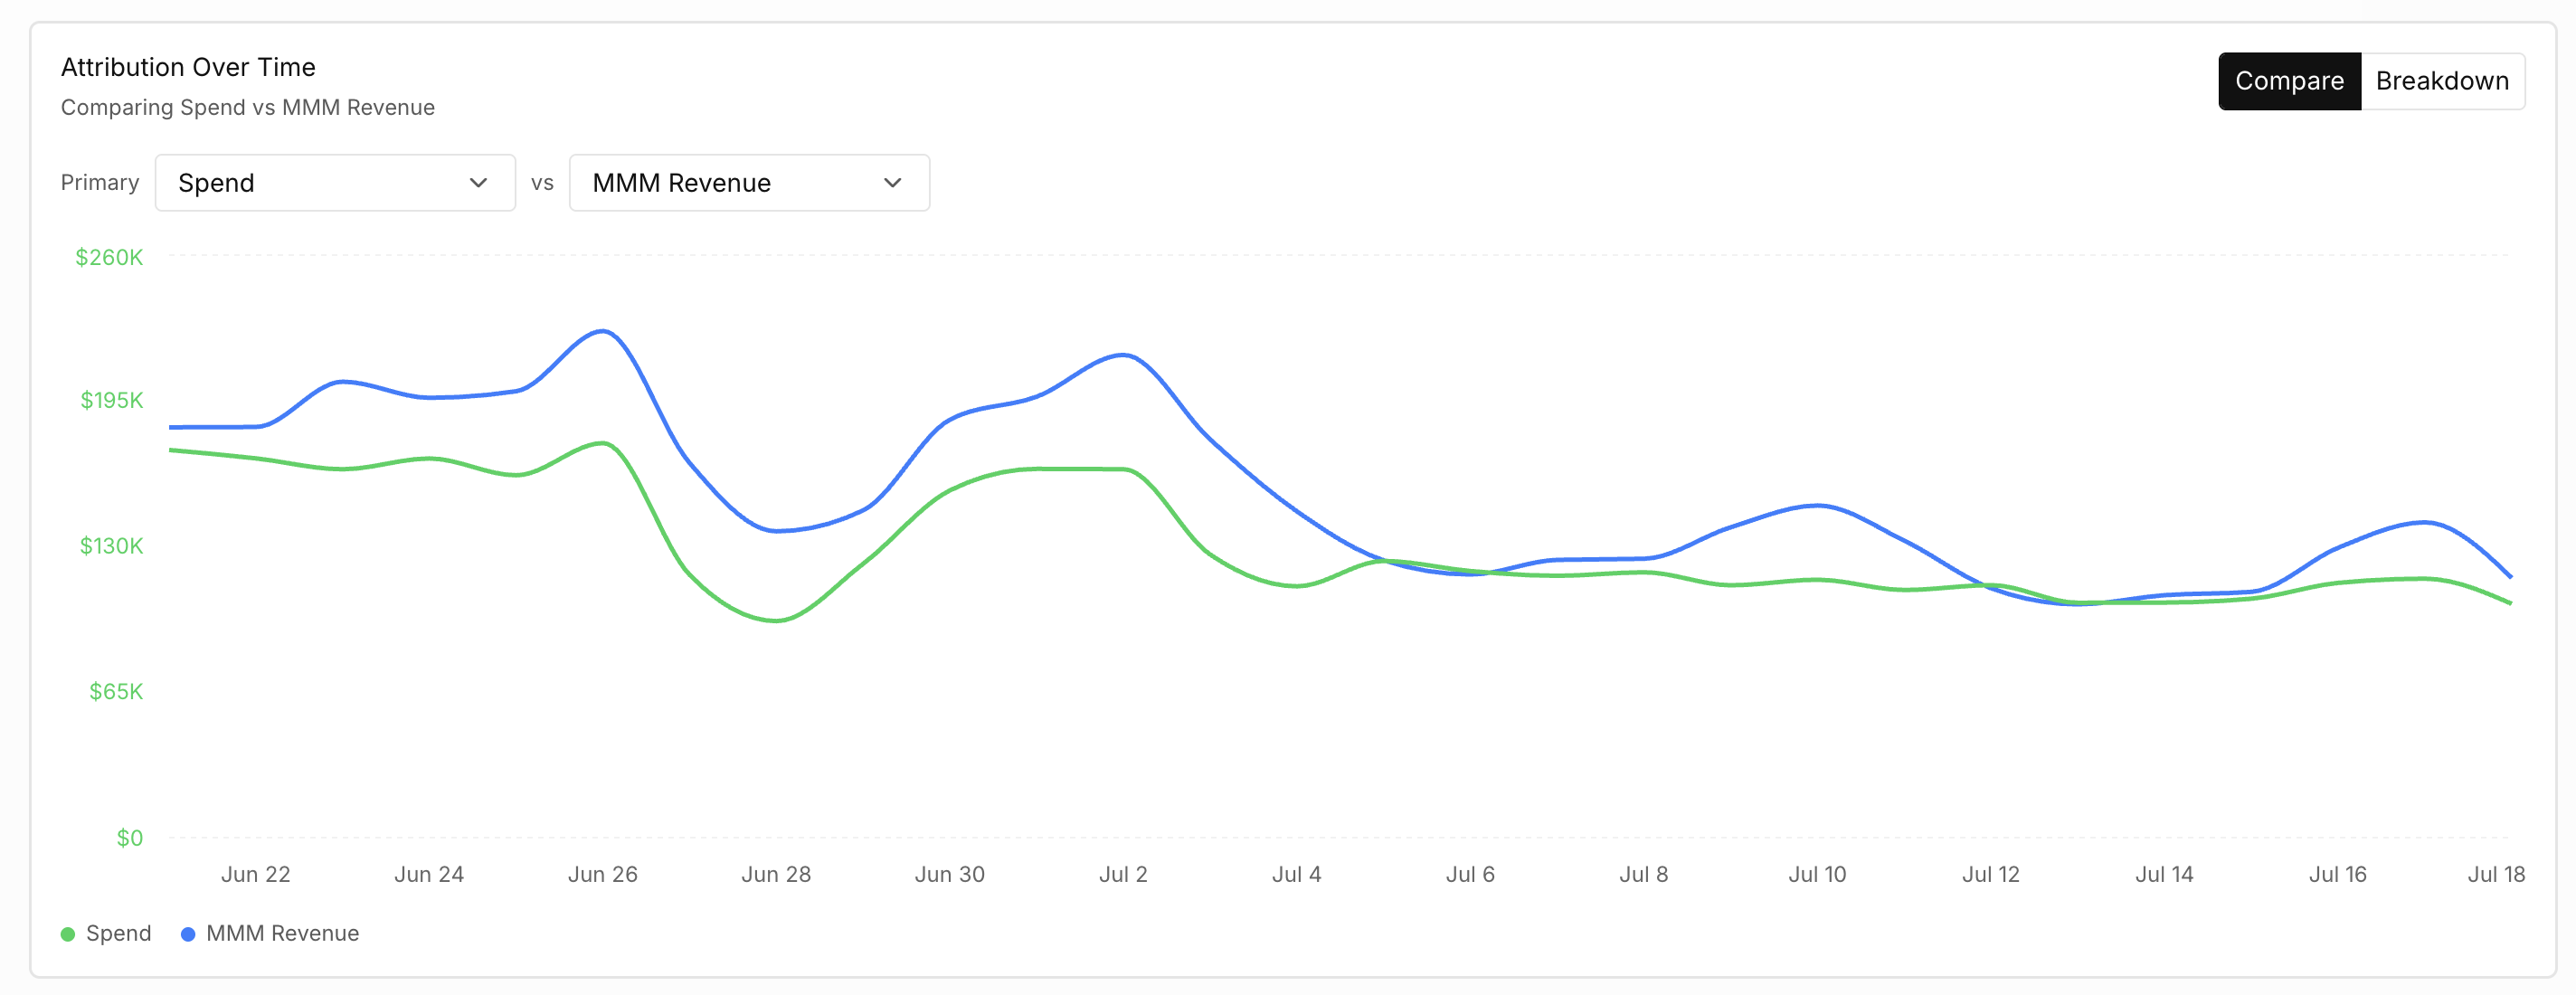
Examples include:
- Spend versus MMM Revenue
- Spend versus reported revenue
- MMM Revenue versus channel-reported revenue
- MMM ROAS versus channel-reported ROAS
Use this view to understand whether changes in spend were followed by changes in modeled performance.
→ Breakdown View
Break down a single metric to understand which components are driving performance over time.
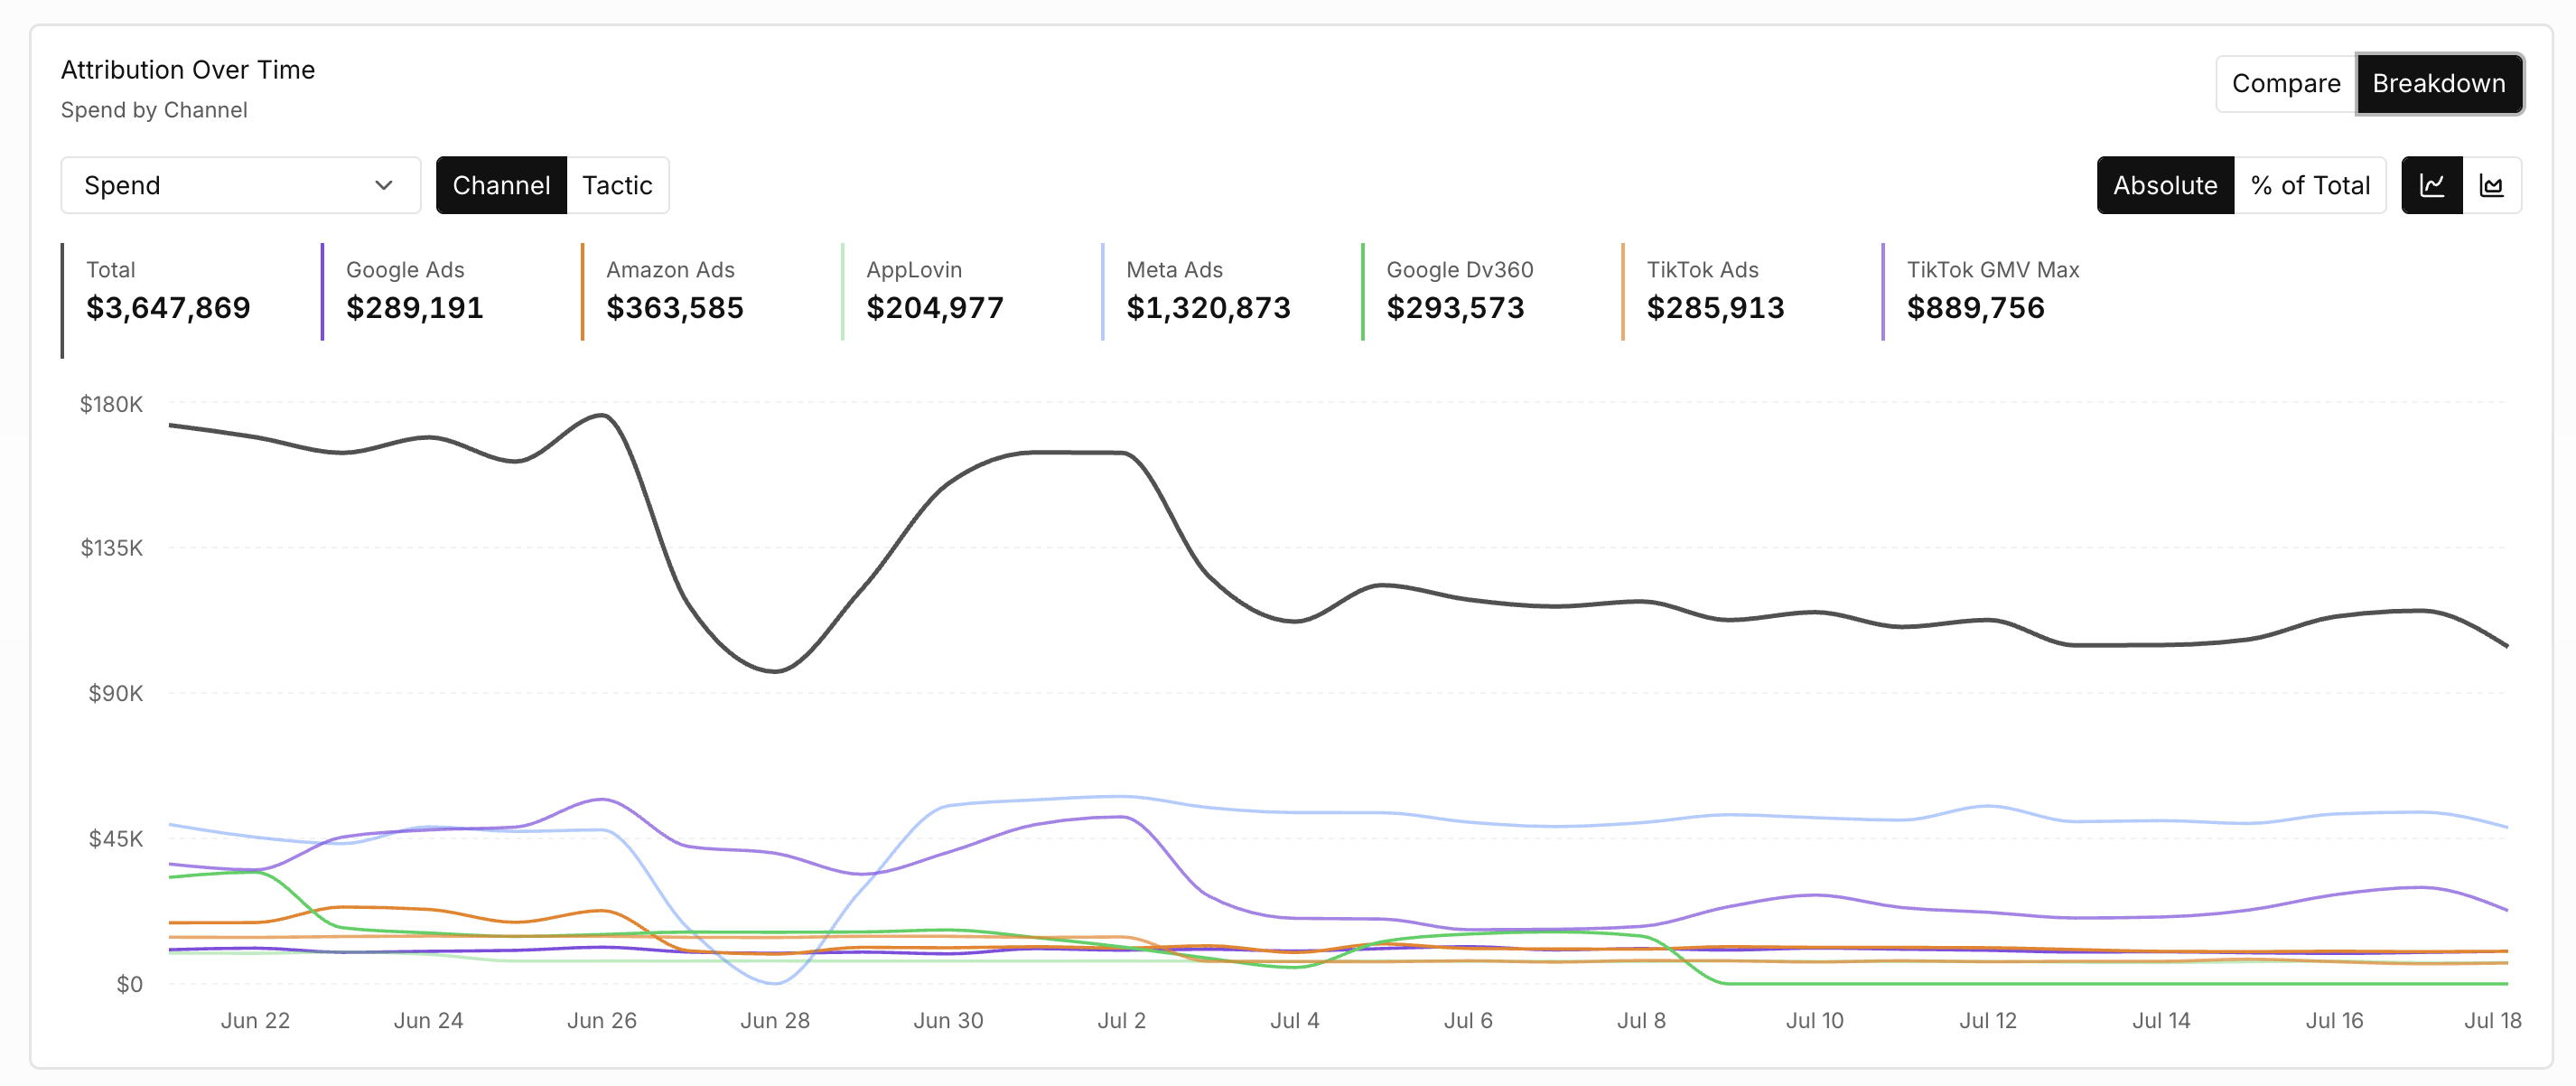
Depending on the selected metric, you can view results by Channel or Tactic.
Additional display options include:
- Absolute: Displays the actual metric values.
- % of Total: Displays each component as a percentage of the total metric.
The summary cards above the chart update to show the total value and the contribution of each selected component for the chosen date range.
4. Performance Table
Use the Performance Table to compare results at different levels of your marketing hierarchy.
Choose a tab between Channels, Tactics and Campaigns to change the level of analysis of the table.
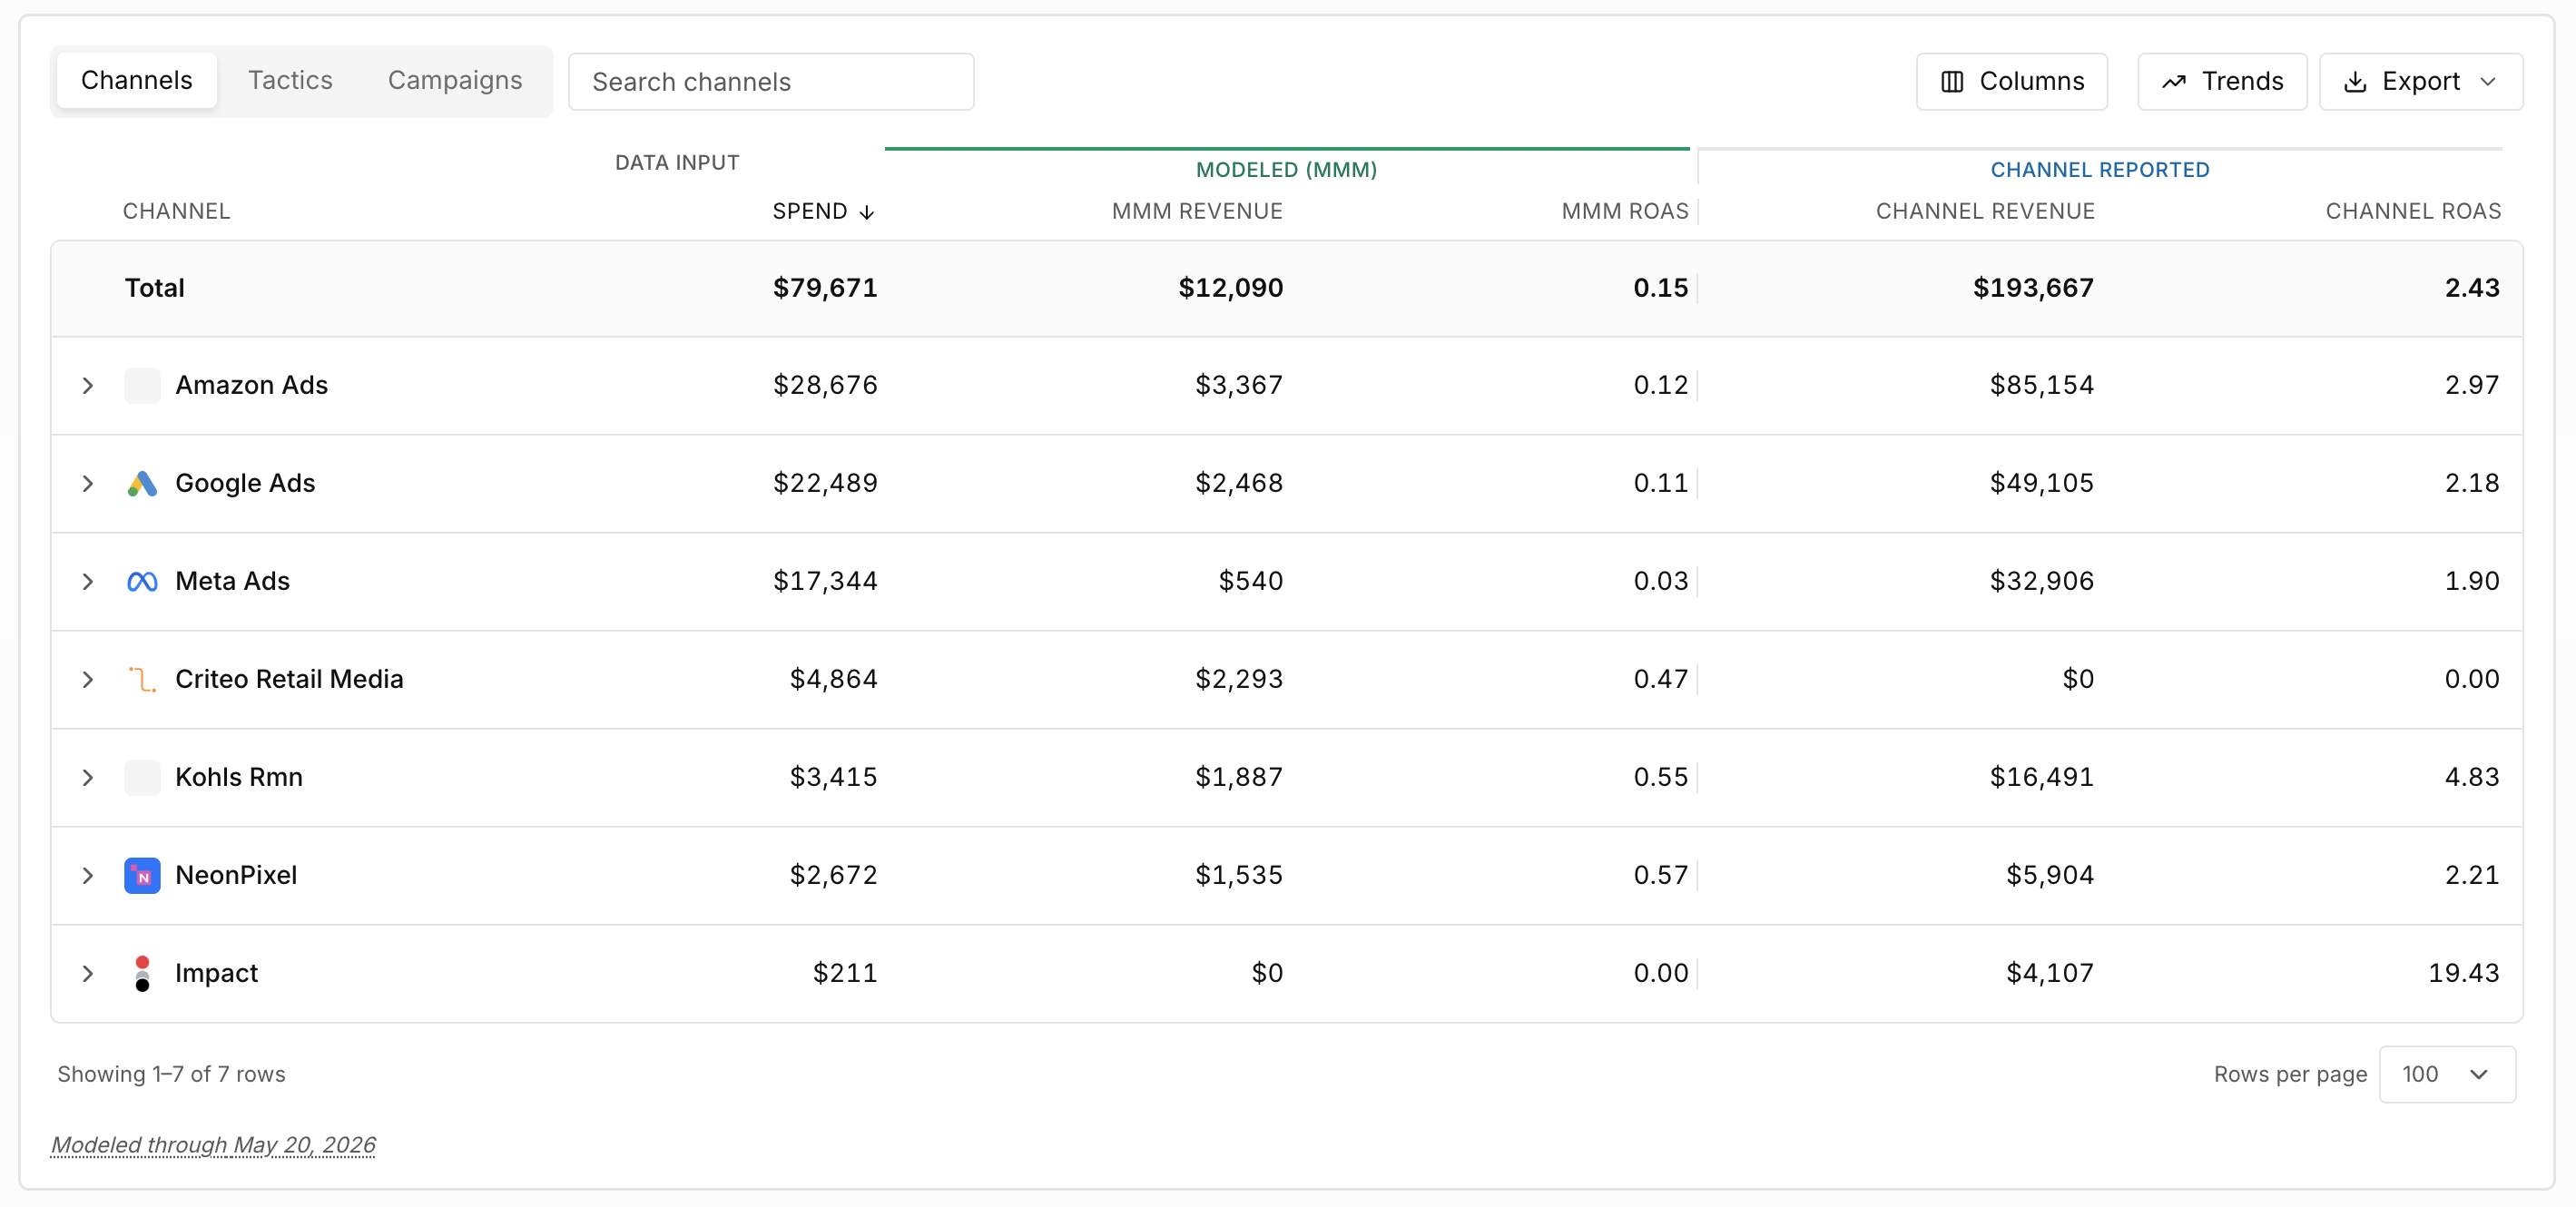
Channel
Compare performance across advertising platforms and media sources.
Tactic
Review groups such as awareness, prospecting, retargeting, or branded search.
Campaign
Analyze individual campaigns at the most granular available level.
For each item, you can compare:
- Spend
- MMM Revenue
- MMM ROAS
- Channel-reported revenue
- Channel-reported ROAS
Explore Performance Trends
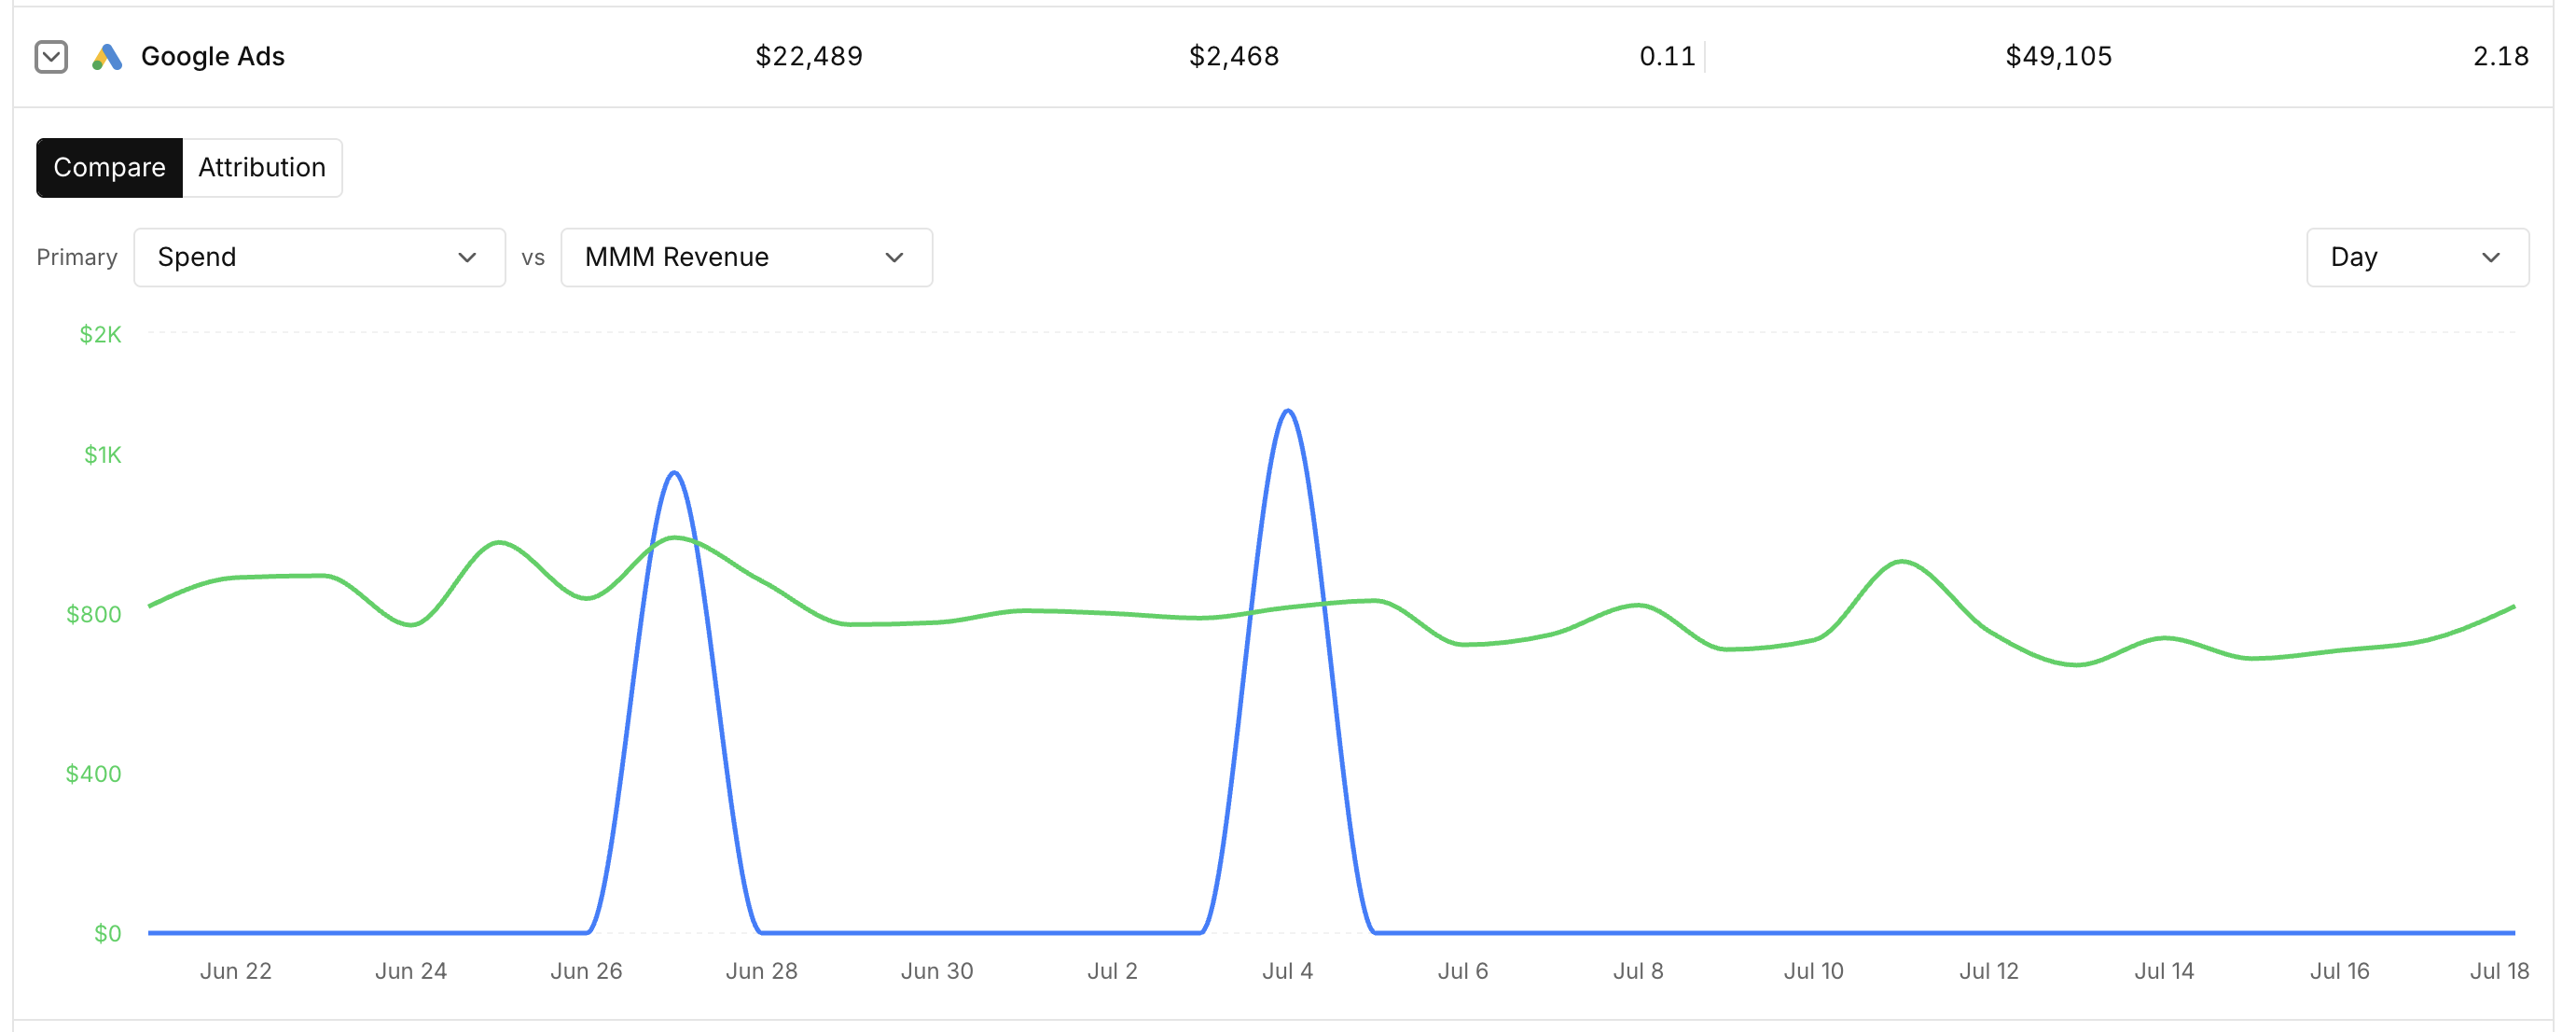
Expand a row to view performance over time for the selected channel, tactic, or campaign.
- Compare two metrics over time
- View Attribution to analyze how the selected item contributes over time
- View the Saturation Plot to compare efficiency across channels, tactics, or campaigns
- Change the reporting interval (Day, Week, or Month).
Saturation Plot
The Saturation Plot helps you understand how changes in spend have historically influenced incremental revenue for a selected campaign.
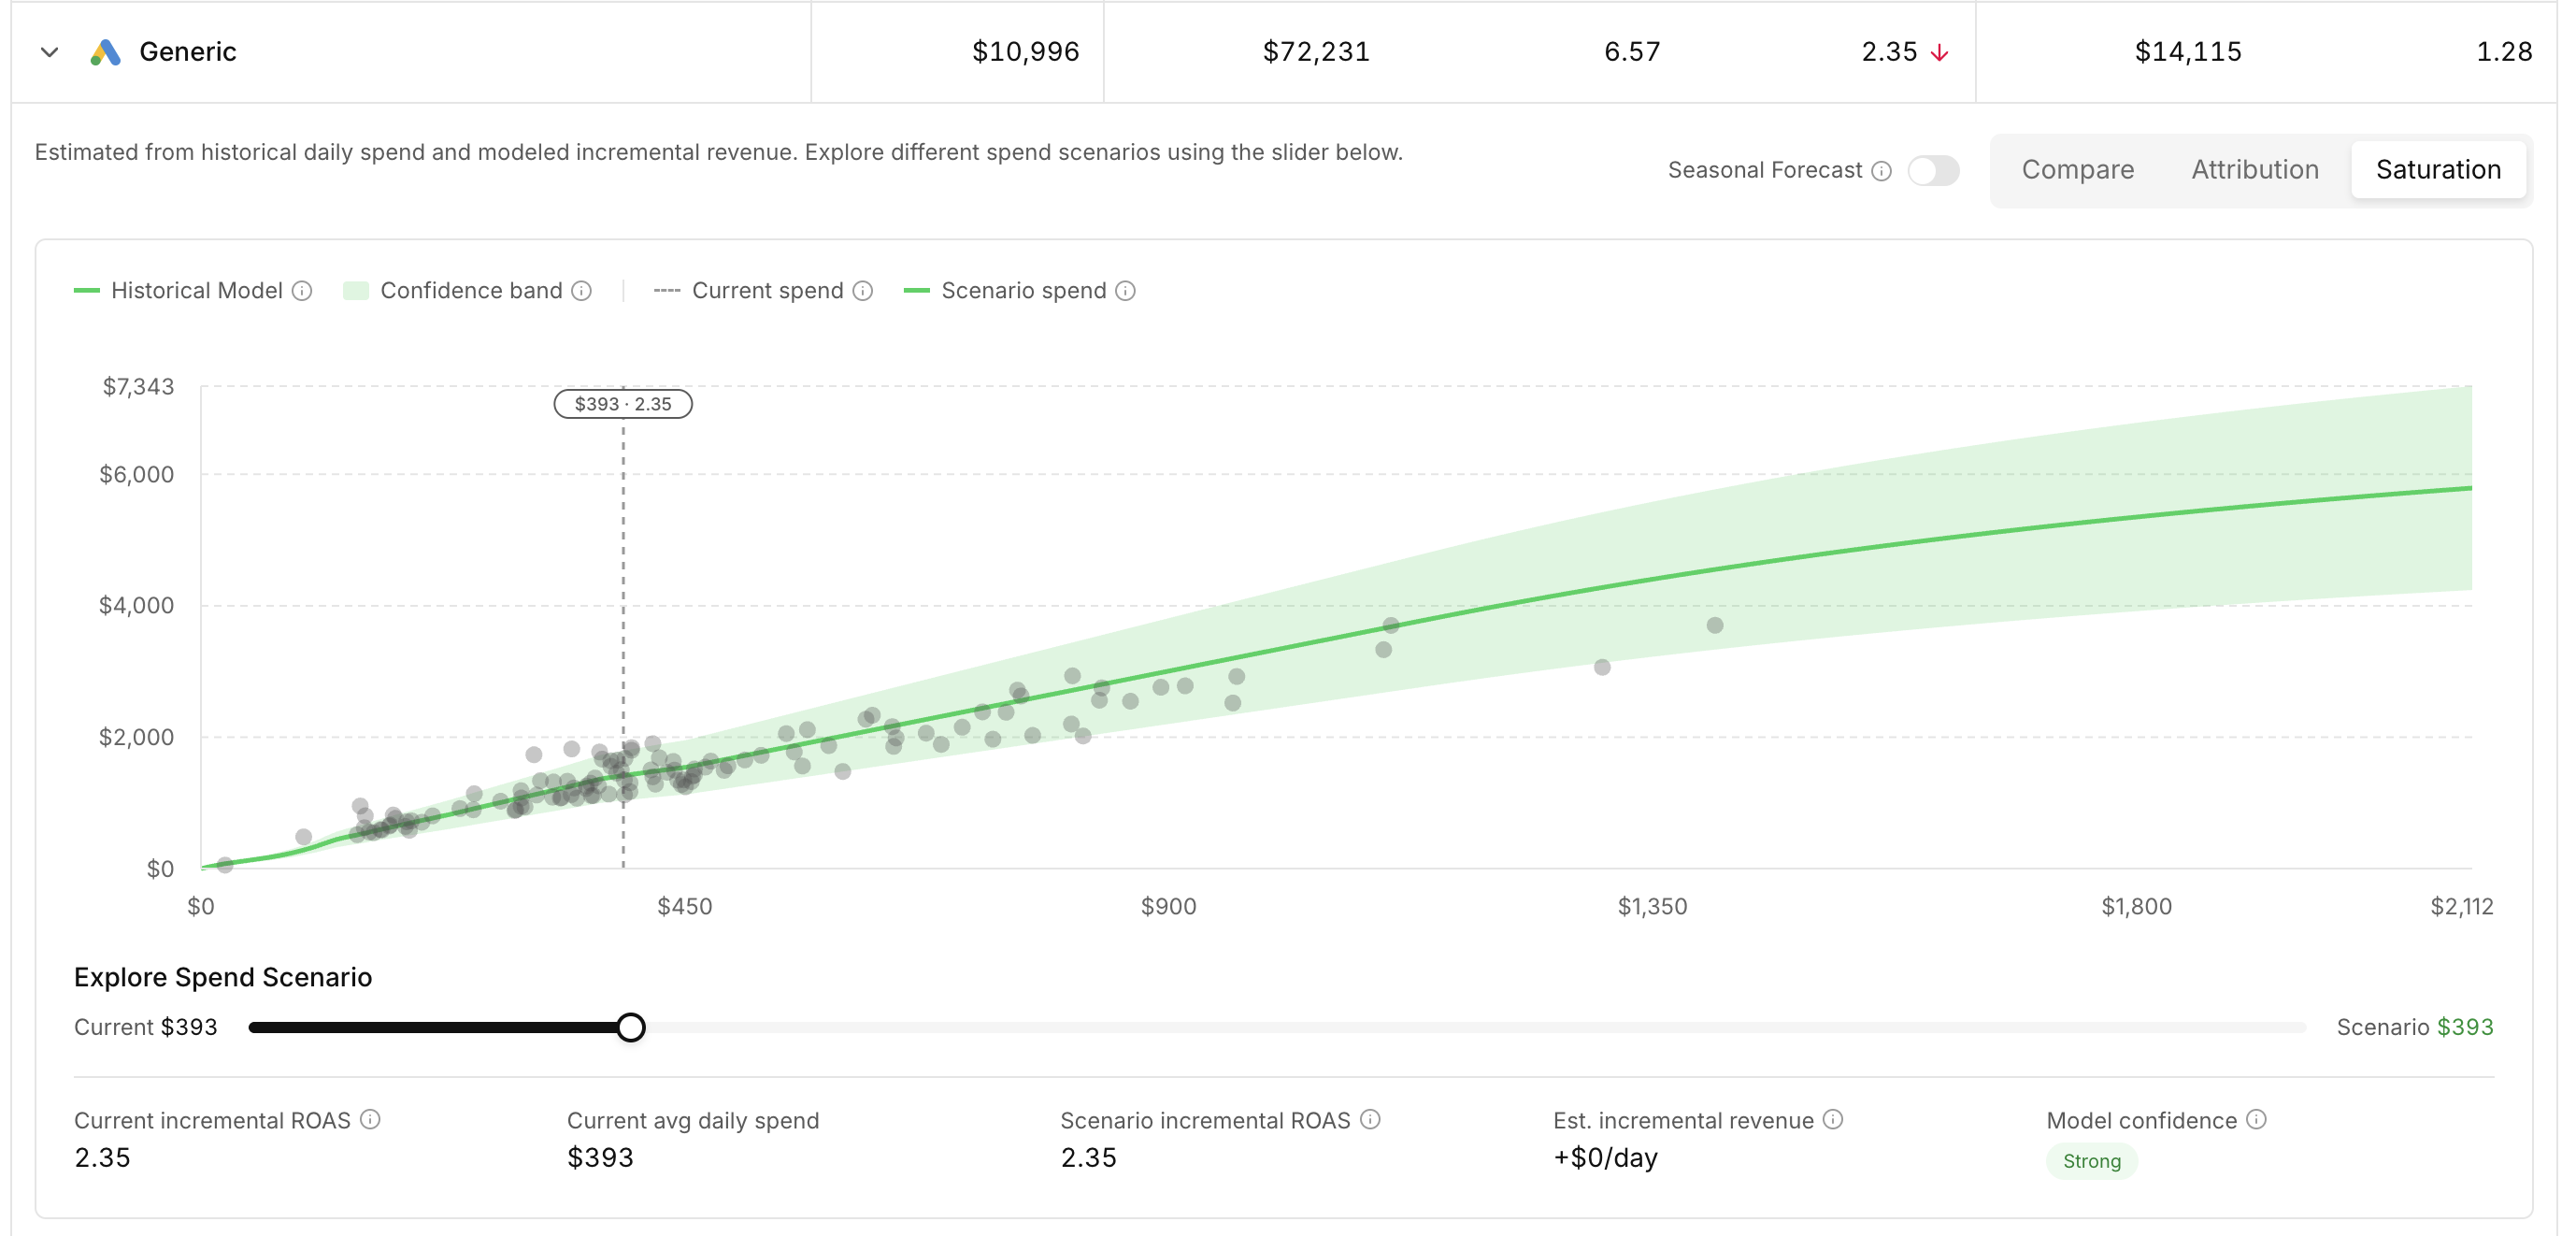
It uses historical model data to estimate how performance may change at different spend levels, making it easier to identify opportunities to scale investment or recognize when returns begin to diminish.
How to read the chart
The chart includes several elements:
Historical Model – The green curve represents the modeled relationship between daily spend and incremental revenue.
Historical Data Points – Each gray dot represents an observed historical spend level and the modeled incremental revenue generated at that spend.
Confidence Band – The shaded green area shows the model's confidence range. Wider bands indicate greater uncertainty in the estimate.
Current Spend – The dashed vertical line marks your current average daily spend.
Scenario Spend – Adjust the slider below the chart to test a different daily spend scenario.
Explore Spend Scenarios
Use the Explore Spend Scenario slider to simulate different spending levels.
As you move the slider, Prescient updates the estimated results based on the historical model.
The summary below the chart includes:
Current Incremental ROAS – The modeled ROAS at your current average daily spend.
Current Average Daily Spend – Your historical average daily investment.
Scenario Incremental ROAS – The estimated ROAS at the selected scenario spend.
Estimated Incremental Revenue – The expected increase or decrease in incremental revenue compared with your current spend.
Model Confidence – Indicates how reliable the estimate is based on the amount and quality of historical data available.
Seasonal Forecast
Seasonal Forecast
Enable Seasonal Forecast to incorporate expected seasonal patterns into the spend curve.
When enabled, the projected relationship between spend and incremental revenue reflects both the historical model and seasonal effects, helping you evaluate scenarios during periods of unusually high or low demand.
Best Practices
Compare scenarios close to your historical spending range for the most reliable estimates.
Consider both Incremental ROAS and Estimated Incremental Revenue when evaluating budget changes.
Use the confidence band to understand how certain the model is at different spend levels.
Treat scenarios far outside your historical spend range as directional guidance rather than precise forecasts.
Tip: The Saturation Plot is based on historical modeled performance. It is designed to help evaluate budget scenarios, not to predict exact future results.
5. Base and Halo Flows
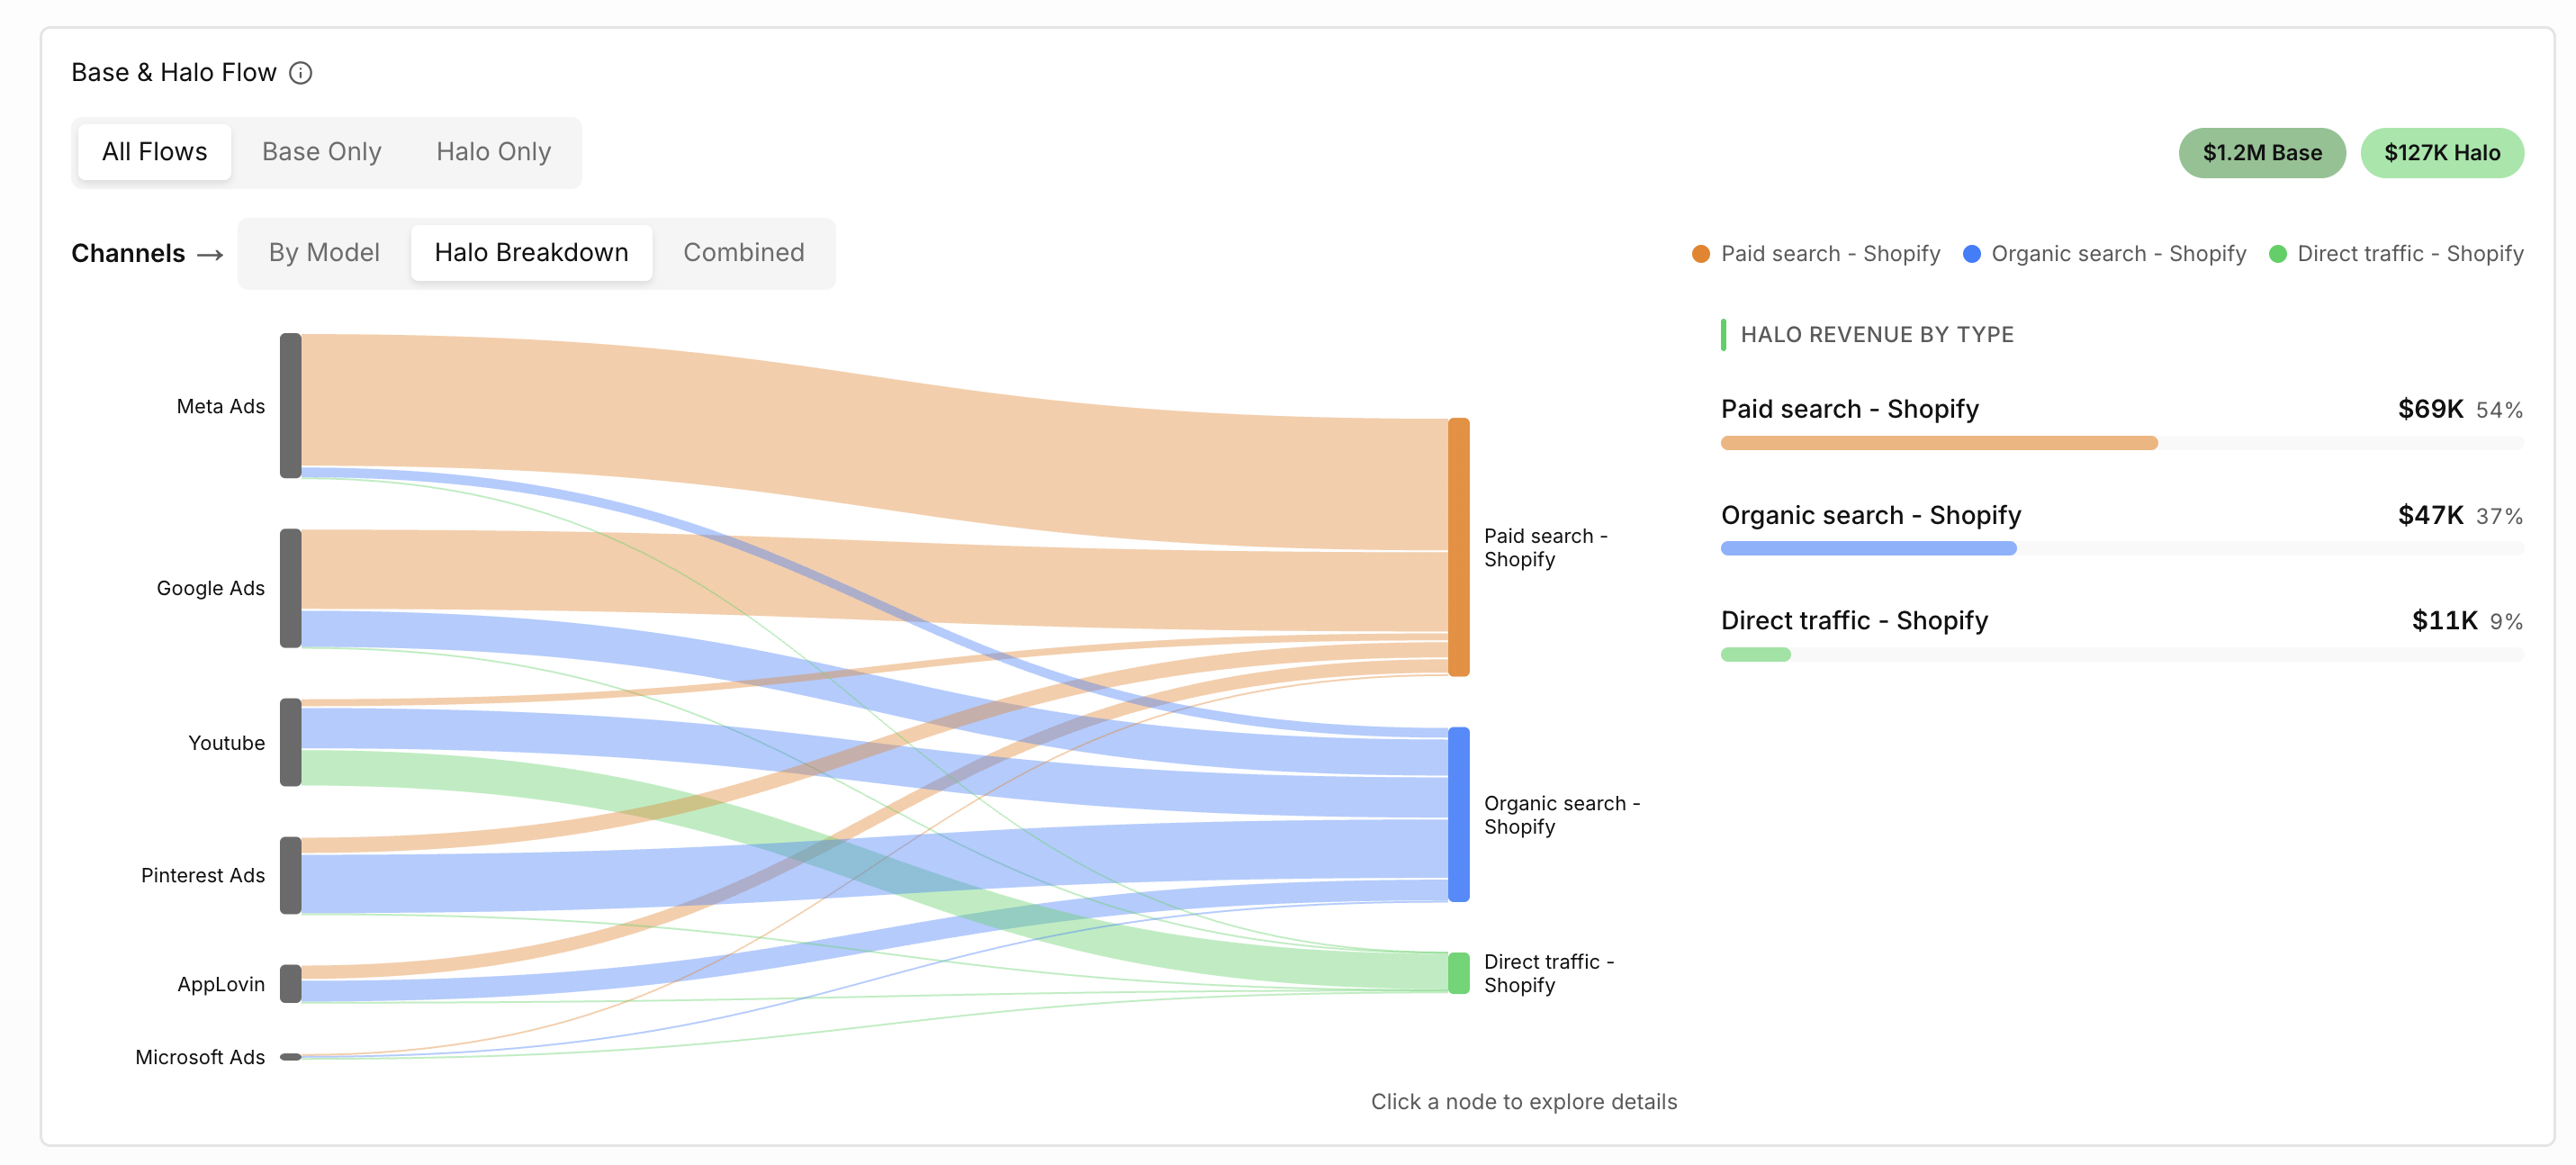
The Base & Halo Flows visualization shows how media channels contribute to revenue across your business outcomes.
- Base represents the direct contribution of a media channel to an outcome.
- Halo represents the indirect contribution, where one channel influences performance in another channel, retailer, or model.
Available Views
Use the controls to explore the data in different ways:
- All flows
- Base contribution only
- Halo contribution only
- Results by model
- Halo breakdowns
- Combined contribution
→ How to read the diagram
- Flows start from the contributing media channel on the left and connect to the outcome on the right.
- Thicker flows represent larger contributions.
- Selecting a node or flow updates the details panel with a breakdown of that contribution.
- Use the view controls to compare direct (Base) and indirect (Halo) impact.
Select a channel or model to explore its relationships in more detail (right panel).
This view is especially useful for identifying media that creates demand but does not receive credit from traditional last-click attribution.
Compare Modeled and Reported Results
Differences between Prescient and advertising-platform reporting are expected.
Channel reporting answers:
Which conversions did this platform claim?
Prescient attribution answers:
What incremental contribution was associated with this media investment across the business?
A channel may appear stronger or weaker in Prescient because the model accounts for baseline demand, delayed impact, and cross-channel Halo Effects.
Best Practices
- Compare similar date ranges when reviewing performance changes.
- Evaluate both Base and Halo contribution.
- Review channel-reported and modeled metrics together.
- Use tactic and campaign views to investigate channel-level results.
- Confirm model health before acting on unexpected findings.
- Use Media Forecaster to test a future budget change.
Key Takeaways
Attribution shows the incremental contribution of your media.
MMM Revenue includes both direct Base and cross-channel Halo Revenue.
Prescient and advertising platforms use different attribution methods.
Results can be analyzed by channel, tactic, and campaign.
Attribution explains historical performance; Media Forecaster helps evaluate what may happen next.
Updated about 1 month ago