
Prescient AI
Understand what is happening—and what to do next
Prescient AI is the starting point for understanding your media performance in Prescient.
AI-powered workspaceIt combines your connected data, MMM results, forecasts, and model health into one AI-powered workspace. Prescient AI highlights important changes, explains what may be driving them, and helps you decide where to investigate next.
Your Performance Brief
When you open Prescient AI, you get a summary of recent media performance.
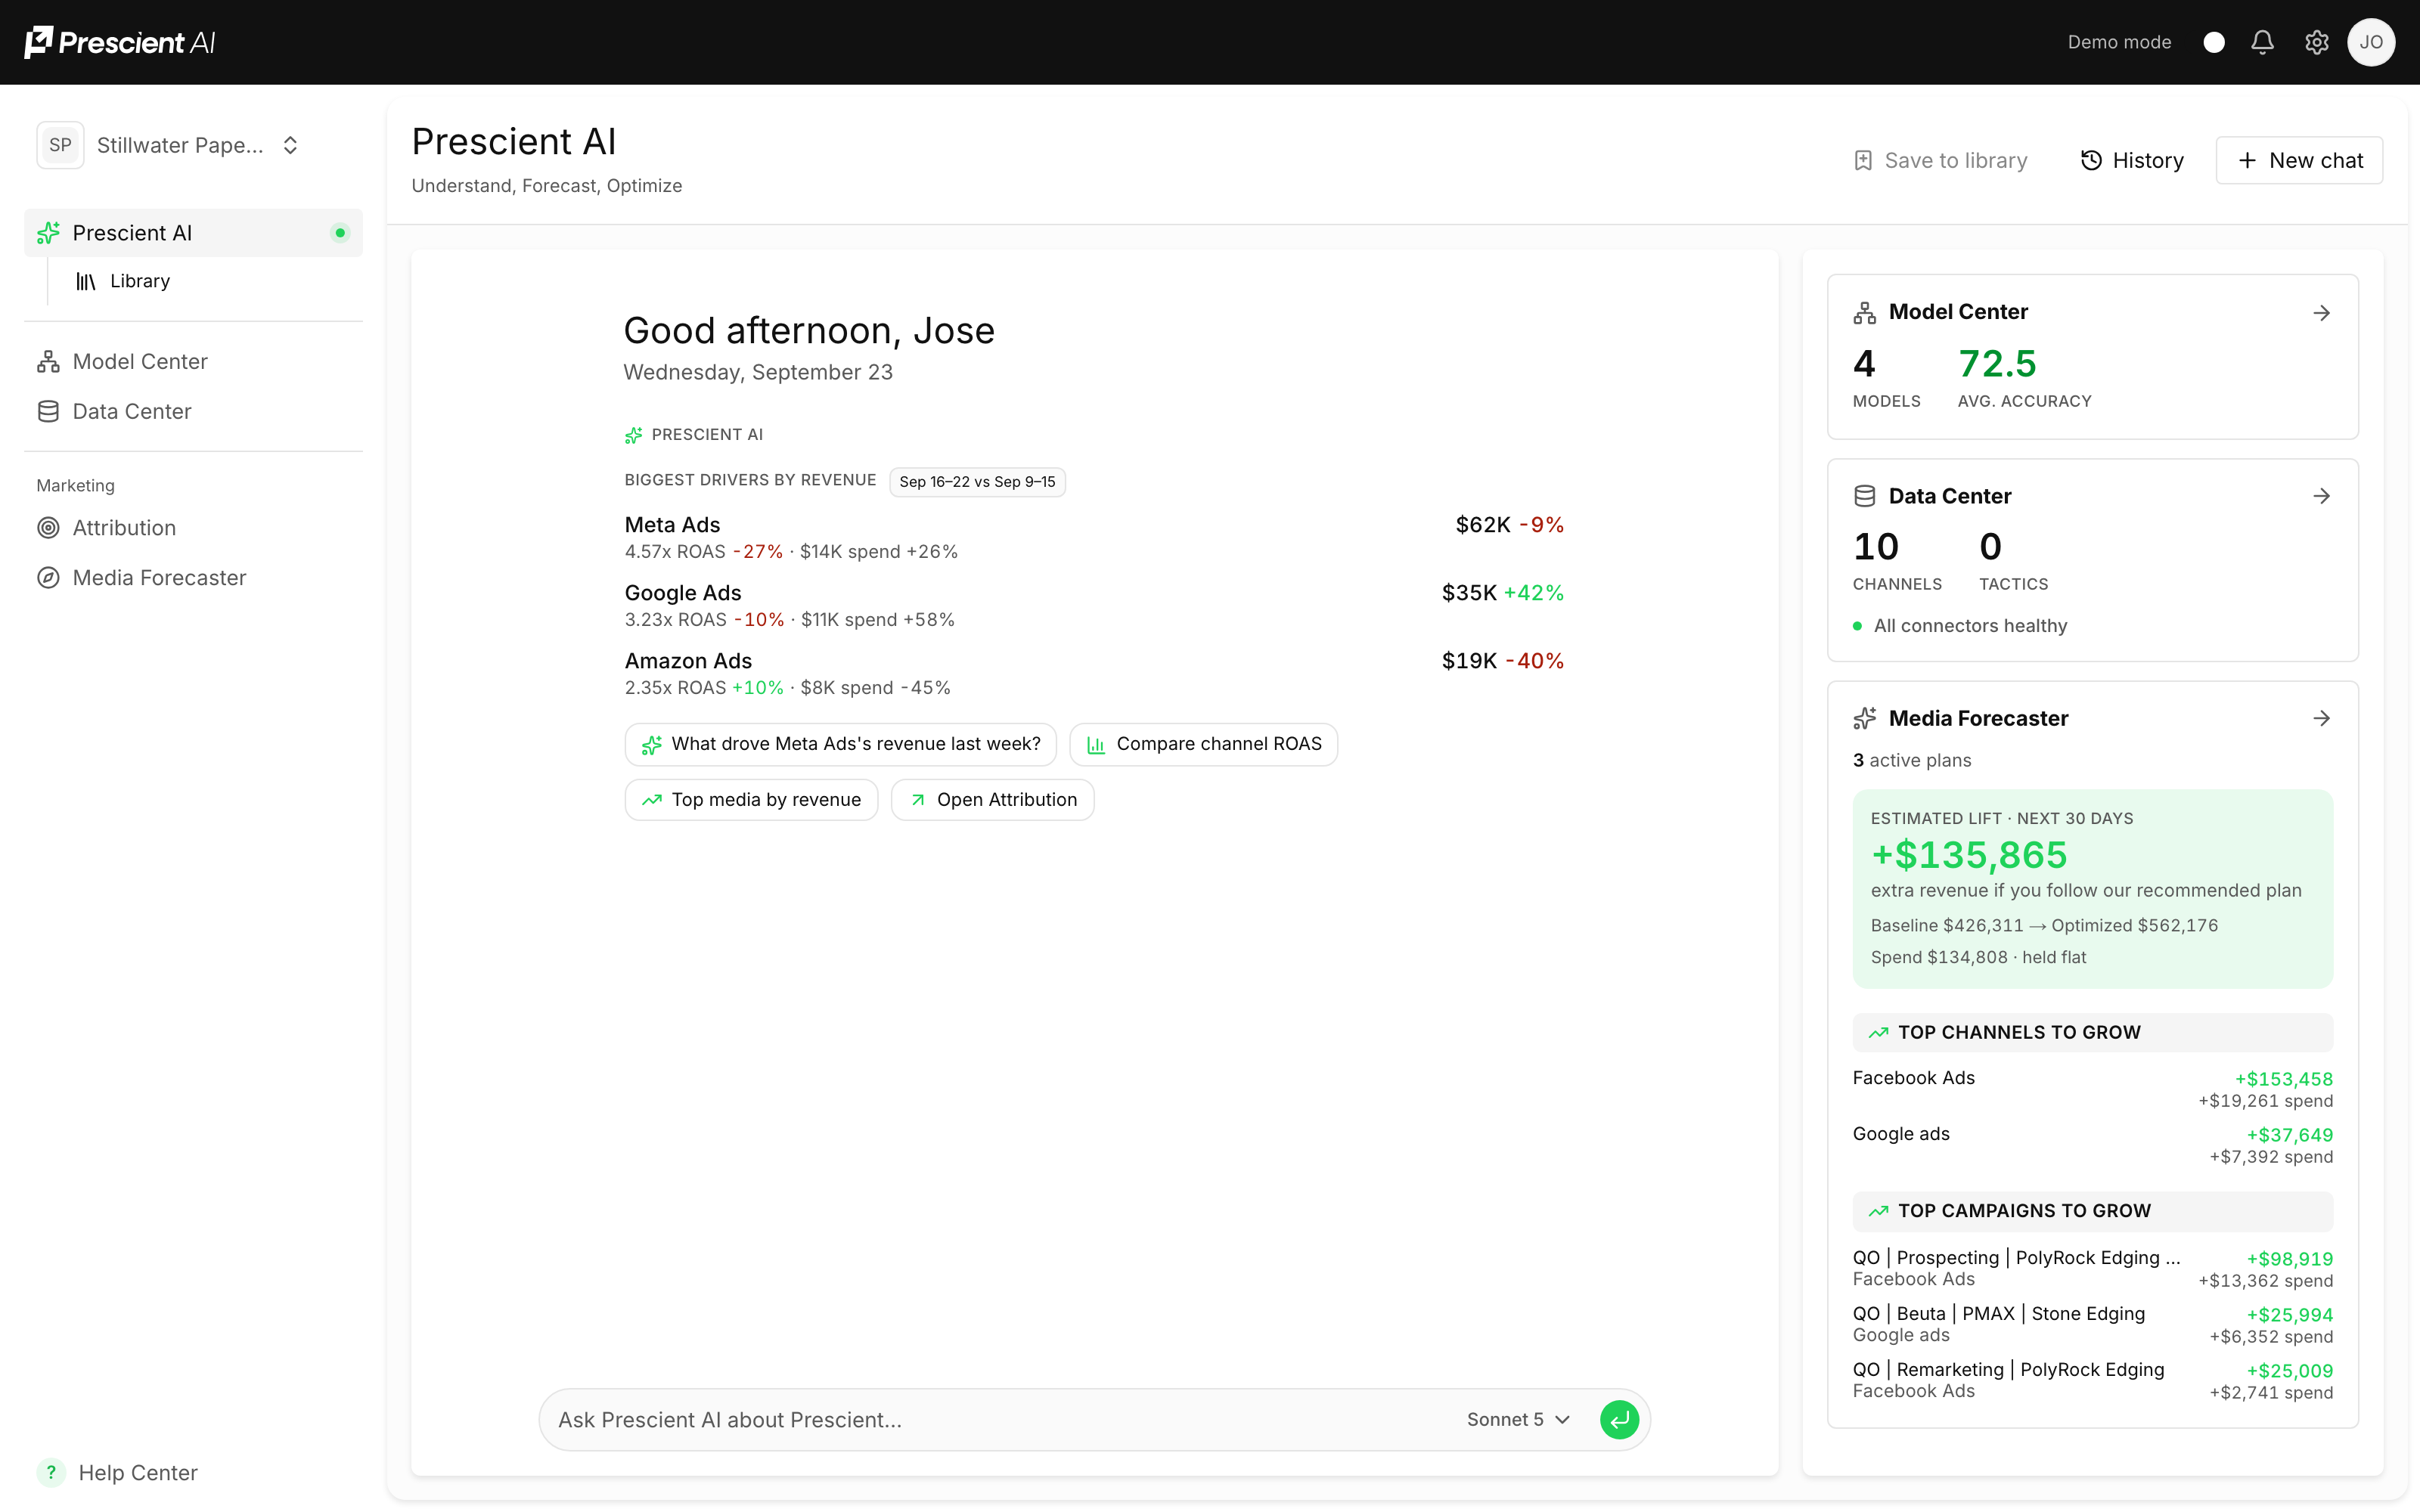
It may highlight:
- Your strongest channels
- Changes in ROAS or CAC
- Revenue and new customer drivers
- Campaigns with room to scale
- Performance that may need attention
- Data or measurability issues
The brief focuses on the information most relevant to your team rather than showing every available metric.
How this fits together
%%{init: {"theme":"base","flowchart":{"curve":"basis","nodeSpacing":50,"rankSpacing":68,"padding":12},"themeVariables":{"fontSize":"14px","primaryColor":"#ffffff","primaryTextColor":"#111111","primaryBorderColor":"#d4d4d4","lineColor":"#8a8a8a","textColor":"#111111","edgeLabelBackground":"#ffffff","clusterBkg":"#fafafa","clusterBorder":"#ebebeb"}}}%%
flowchart LR
  DC("<b>Data Center</b><br/>connectors · channels · tactics") --> MC("<b>Model Center</b><br/>are the models trustworthy?")
  MC --> ATT("<b>Attribution</b><br/>what your media did")
  MC --> MF("<b>Media Forecaster</b><br/>what to do next")
  AI("<b>Prescient AI</b><br/>ask across all of it") -.-> ATT
  AI -.-> MF
  MF --> EX("<b>You execute</b><br/>in your ad platforms")
  EX --> DC
  classDef here fill:#111111,stroke:#111111,stroke-width:1.5px,color:#ffffff
  classDef accent fill:#f1fcf5,stroke:#1fd25a,stroke-width:1.5px,color:#111111
  classDef choice fill:#fafafa,stroke:#c9c9c9,stroke-width:1.5px,color:#5a5a5a
  class AI here
  linkStyle default stroke:#8a8a8a,stroke-width:2px
Ask Prescient AI
%%{init: {"theme":"base","flowchart":{"curve":"basis","nodeSpacing":50,"rankSpacing":68,"padding":12},"themeVariables":{"fontSize":"14px","primaryColor":"#ffffff","primaryTextColor":"#111111","primaryBorderColor":"#d4d4d4","lineColor":"#8a8a8a","textColor":"#111111","edgeLabelBackground":"#ffffff","clusterBkg":"#fafafa","clusterBorder":"#ebebeb"}}}%%
flowchart TD
  Q("<b>You ask a question</b><br/>in plain language") --> G("<b>Answered from your own</b><br/>models and data")
  G --> C("<b>A chart, when a chart</b><br/>explains it better")
  G --> S("<b>The sources it used</b>")
  C --> K{"<b>Worth keeping?</b>"}
  S --> K
  K -->|"yes"| L("<b>Save to the Library</b>")
  K -->|"no"| Q
  L --> SH("<b>Share with your team</b><br/>or print to PDF")
  L --> R("<b>Run again later</b><br/>against current data")
  classDef here fill:#111111,stroke:#111111,stroke-width:1.5px,color:#ffffff
  classDef accent fill:#f1fcf5,stroke:#1fd25a,stroke-width:1.5px,color:#111111
  classDef choice fill:#fafafa,stroke:#c9c9c9,stroke-width:1.5px,color:#5a5a5a
  class L accent
  class K choice
  linkStyle default stroke:#8a8a8a,stroke-width:2px
Find your way around
Get an answer
Your performance brief · Ask Prescient AI · What it is grounded in
Keep and share it
The Library · Workspace overview
Reference
From insight to action · Best practices · FAQs
Grounded in Your Models and Data
Prescient AI uses your organization’s connected data and MMM results.
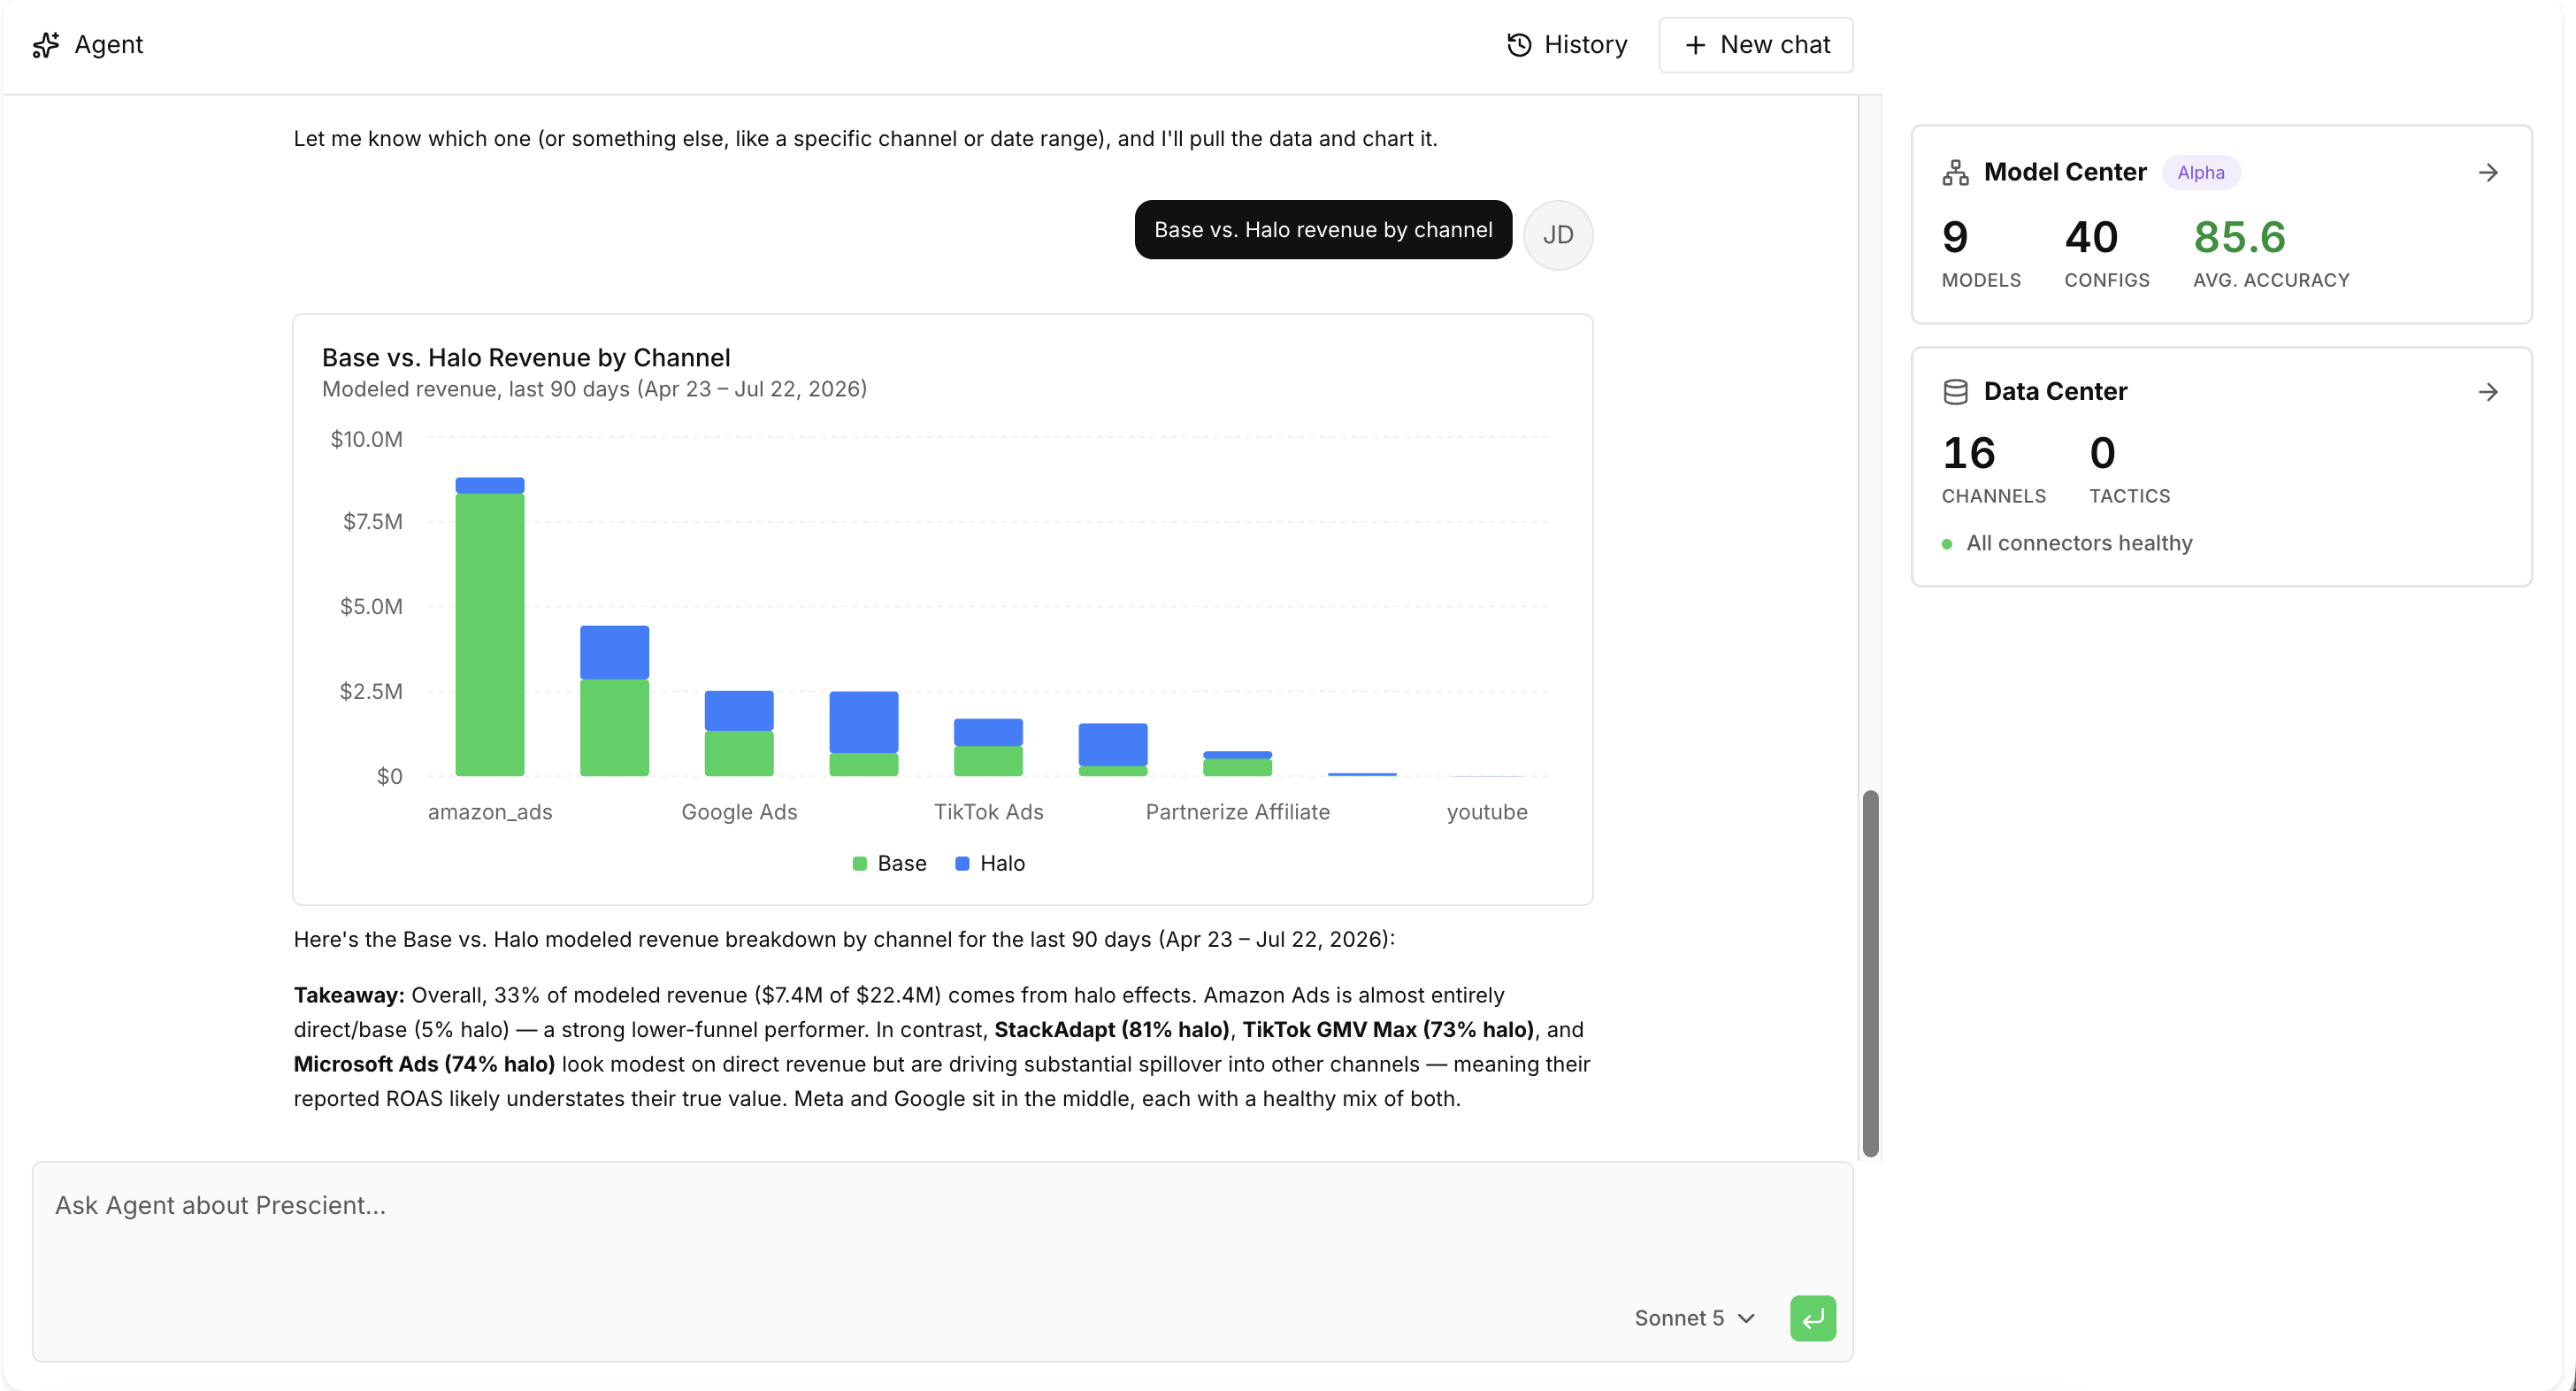
The underlying models calculate:
- Incremental revenue and new customers
- MMM ROAS and CAC
- Base and Halo Effects
- Media response curves
- Forecasted performance
- Model accuracy and confidence
Prescient AI helps explain these results, identify meaningful changes, and guide you to the right next step.
It does not replace the underlying models or generate unsupported forecasts.
Ask Prescient AI
Use the chat box to ask questions about your media performance in natural language.

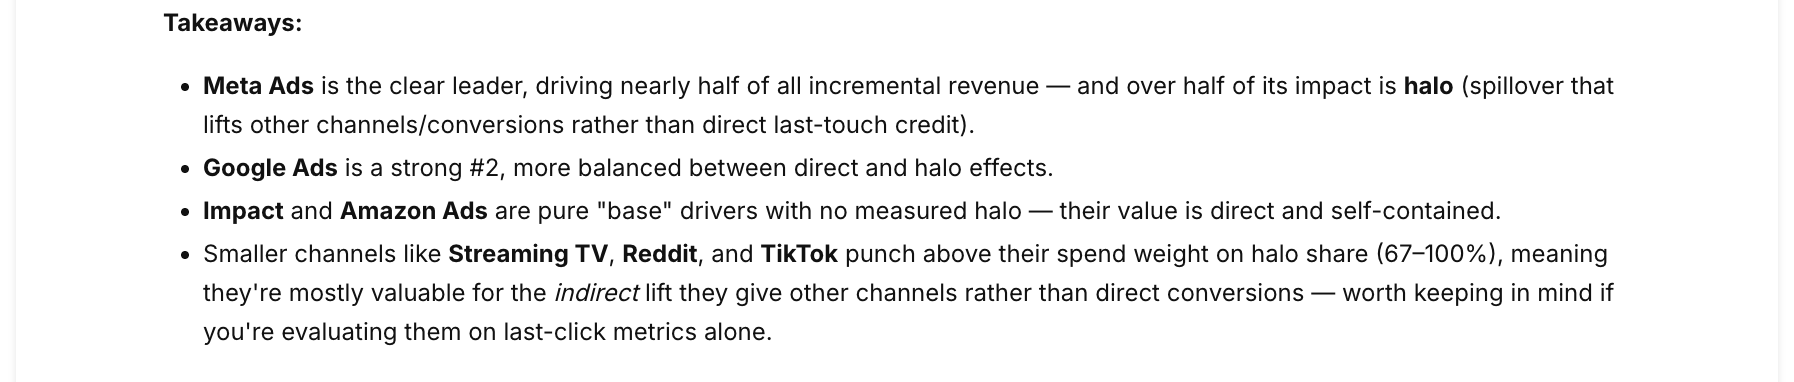
For example:
- Why is Meta performance declining?
- Which channels generated the most incremental revenue?
- What are our biggest opportunities to scale?
- How did Google perform this month?
- Which campaigns need more data?
- Where could we move budget to improve ROAS?
You can also select one of the suggested questions shown on the page.
Answers include charts
Where a chart explains the answer better than a sentence, Prescient AI draws one
using the same data the dashboards use — so a question about which tactics drove
incremental revenue returns a readable breakdown rather than a list of numbers.
Answers cite the models and data they drew on. Select a source to see what the
answer was based on.
The Library
The Library is where answers worth keeping are saved, revisited and shared.
When an answer is one your team will want again, save it to the Library instead of
re-running the question.
A saved answer is a snapshot
Saving keeps the answer as it was — the numbers at the time you saved it.
Reopening a saved item shows what it said then, not a recalculation. That is
deliberate: an answer you shared with your team should not quietly change
underneath them.
To bring it up to date, open the item and choose Run again, which produces a
fresh answer against current data.
Who can see it
| Setting | Who can open it |
|---|---|
| Private | Only you and Prescient staff can open it |
| Workspace | Anyone in your workspace can read it |
Use the Mine filter on the Library index to see only your own items. Nothing in
the Library is visible to another client organization.
Sharing and printing
- Copy link — anyone in your workspace with access can open it. A private item stays private.
- Print — opens a clean, print-ready version with the app navigation removed, so it saves to PDF without the surrounding interface.
Workspace Overview
The cards on the right side of the page provide a quick view of key areas across Prescient.
Model Center
Review your active models, configurations, and average model accuracy.
Data Center
Check your connected data sources, business context, tactics, and connector health.
Media Forecaster
View active media plans, projected lift, and potential optimization opportunities.
Measurability
See which channels and campaigns have enough signal to support reliable forecasting.
Select any card to open the full feature.
From Insight to Action
A typical workflow is:
- Review your performance brief.
- Ask a follow-up question.
- Save the answer to the Library if your team will need it again.
- Examine the supporting model results.
- Open Attribution, Media Forecaster, Model Center, or Measurability.
- Evaluate the recommendation using your business context.
- Test the change and monitor performance.
Best Practices
Ask focused questions that include a metric, timeframe, or objective.
For example:
Instead of:
How is Meta doing?
Ask:
Why did Meta MMM ROAS decline over the last 30 days?
Use Prescient AI to prioritize your analysis, then review the relevant feature before making a significant media decision.
FAQs
Does a saved Library answer update when my data updates?
No. A saved item is a snapshot of the answer at the time it was saved. Use Run again for a current version.
Can my whole team see everything I save?
Only what you set to workspace visibility. Items marked Private are visible to you and to Prescient staff.
Can I share a Library item with someone outside my company?
Not by link — Library access follows workspace access. Use Print to produce a PDF.
Why did the answer change when I ran it again?
It was re-computed against current data. Models refresh, and recent periods firm up as more data arrives.
What can Prescient AI not answer?
Anything outside the data Prescient has modeled for your organization. It says so plainly rather than estimating, and it cannot change anything in your account — it reads, it does not act.
Key Takeaways
- Prescient AI is grounded in your connected data and MMM results.
- The models calculate performance and forecasts; AI helps explain them.
- Suggested questions make it easy to begin investigating.
- Save answers to the Library to share them without re-running the question.
- A saved answer is a snapshot; use Run again to refresh it.
- Workspace cards provide quick access to models, data, forecasting, and measurability.
- Important recommendations should be reviewed alongside model confidence and business context.
Updated 8 days ago