
Media Forecaster
Forecast and optimize future media performance
The Media Forecaster helps you build forward-looking media plans using Prescient’s MMM models.
Create a plan to understand how a fixed budget could be distributed across your media mix to maximize modeled revenue. Prescient evaluates the expected performance of each included channel and tactic, then compares the optimized plan with your current baseline.
Use the Media Forecaster to:
- Build plans for future dates
- Forecast media revenue and ROAS
- Optimize a fixed marketing budget
- Compare current and recommended allocations
- Evaluate multiple channels, tactics, and outcome models together
- Monitor actual performance after a plan begins
- Share planning scenarios with your team
- Bound how much a channel or tactic can be allocated
- See the spend and expected return for each period of the plan
- Duplicate a plan to explore a variation without losing the original
How the Media Forecaster fits in
Prescient models what your media actually did, then uses those same models to work
out what to do next. The Media Forecaster is the "what next" half.
%%{init: {"theme":"base","flowchart":{"curve":"basis","nodeSpacing":50,"rankSpacing":68,"padding":12},"themeVariables":{"fontSize":"14px","primaryColor":"#ffffff","primaryTextColor":"#111111","primaryBorderColor":"#d4d4d4","lineColor":"#8a8a8a","textColor":"#111111","edgeLabelBackground":"#ffffff","clusterBkg":"#fafafa","clusterBorder":"#ebebeb"}}}%%
flowchart LR
  DC("<b>Data Center</b><br/>connectors · channels · tactics") --> MC("<b>Model Center</b><br/>are the models trustworthy?")
  MC --> ATT("<b>Attribution</b><br/>what your media did")
  MC --> MF("<b>Media Forecaster</b><br/>what to do next")
  AI("<b>Prescient AI</b><br/>ask across all of it") -.-> ATT
  AI -.-> MF
  MF --> EX("<b>You execute</b><br/>in your ad platforms")
  EX --> DC
  classDef here fill:#111111,stroke:#111111,stroke-width:1.5px,color:#ffffff
  classDef accent fill:#f1fcf5,stroke:#1fd25a,stroke-width:1.5px,color:#111111
  classDef choice fill:#fafafa,stroke:#c9c9c9,stroke-width:1.5px,color:#5a5a5a
  class MF here
  linkStyle default stroke:#8a8a8a,stroke-width:2px
How a plan works
Every plan follows the same shape. Most of this page is detail on one of these steps.
%%{init: {"theme":"base","flowchart":{"curve":"basis","nodeSpacing":50,"rankSpacing":68,"padding":12},"themeVariables":{"fontSize":"14px","primaryColor":"#ffffff","primaryTextColor":"#111111","primaryBorderColor":"#d4d4d4","lineColor":"#8a8a8a","textColor":"#111111","edgeLabelBackground":"#ffffff","clusterBkg":"#fafafa","clusterBorder":"#ebebeb"}}}%%
flowchart TD
  A("<b>Choose a goal</b><br/>and a budget") --> B("<b>Pick the media</b><br/>to include")
  B --> C("<b>Set limits</b><br/>min / max spend")
  C --> D("<b>Run the plan</b>")
  D --> E("<b>Review</b><br/>summary · breakdown · schedule")
  E -->|"looks right"| F("<b>Execute in your platforms</b>")
  E -->|"not quite"| G("<b>Duplicate and adjust</b>")
  G --> D
  F --> H("<b>Monitor pacing</b><br/>while it runs")
  classDef here fill:#111111,stroke:#111111,stroke-width:1.5px,color:#ffffff
  classDef accent fill:#f1fcf5,stroke:#1fd25a,stroke-width:1.5px,color:#111111
  classDef choice fill:#fafafa,stroke:#c9c9c9,stroke-width:1.5px,color:#5a5a5a
  class F accent
  linkStyle default stroke:#8a8a8a,stroke-width:2px
Find your way around
Build a plan
Create a plan · Choose the media · Set min and max spend · Adjust the budget
Read the result
Plan summary · Baseline vs Optimized vs Actual · Media breakdown · The plan schedule · Export
Run and adjust
Monitor an active plan · Duplicate a plan
Reference
Best practices · FAQs
Build a plan
Everything that happens before you press run.
Create a New Plan
The plan setup page defines the question you want Prescient to answer.
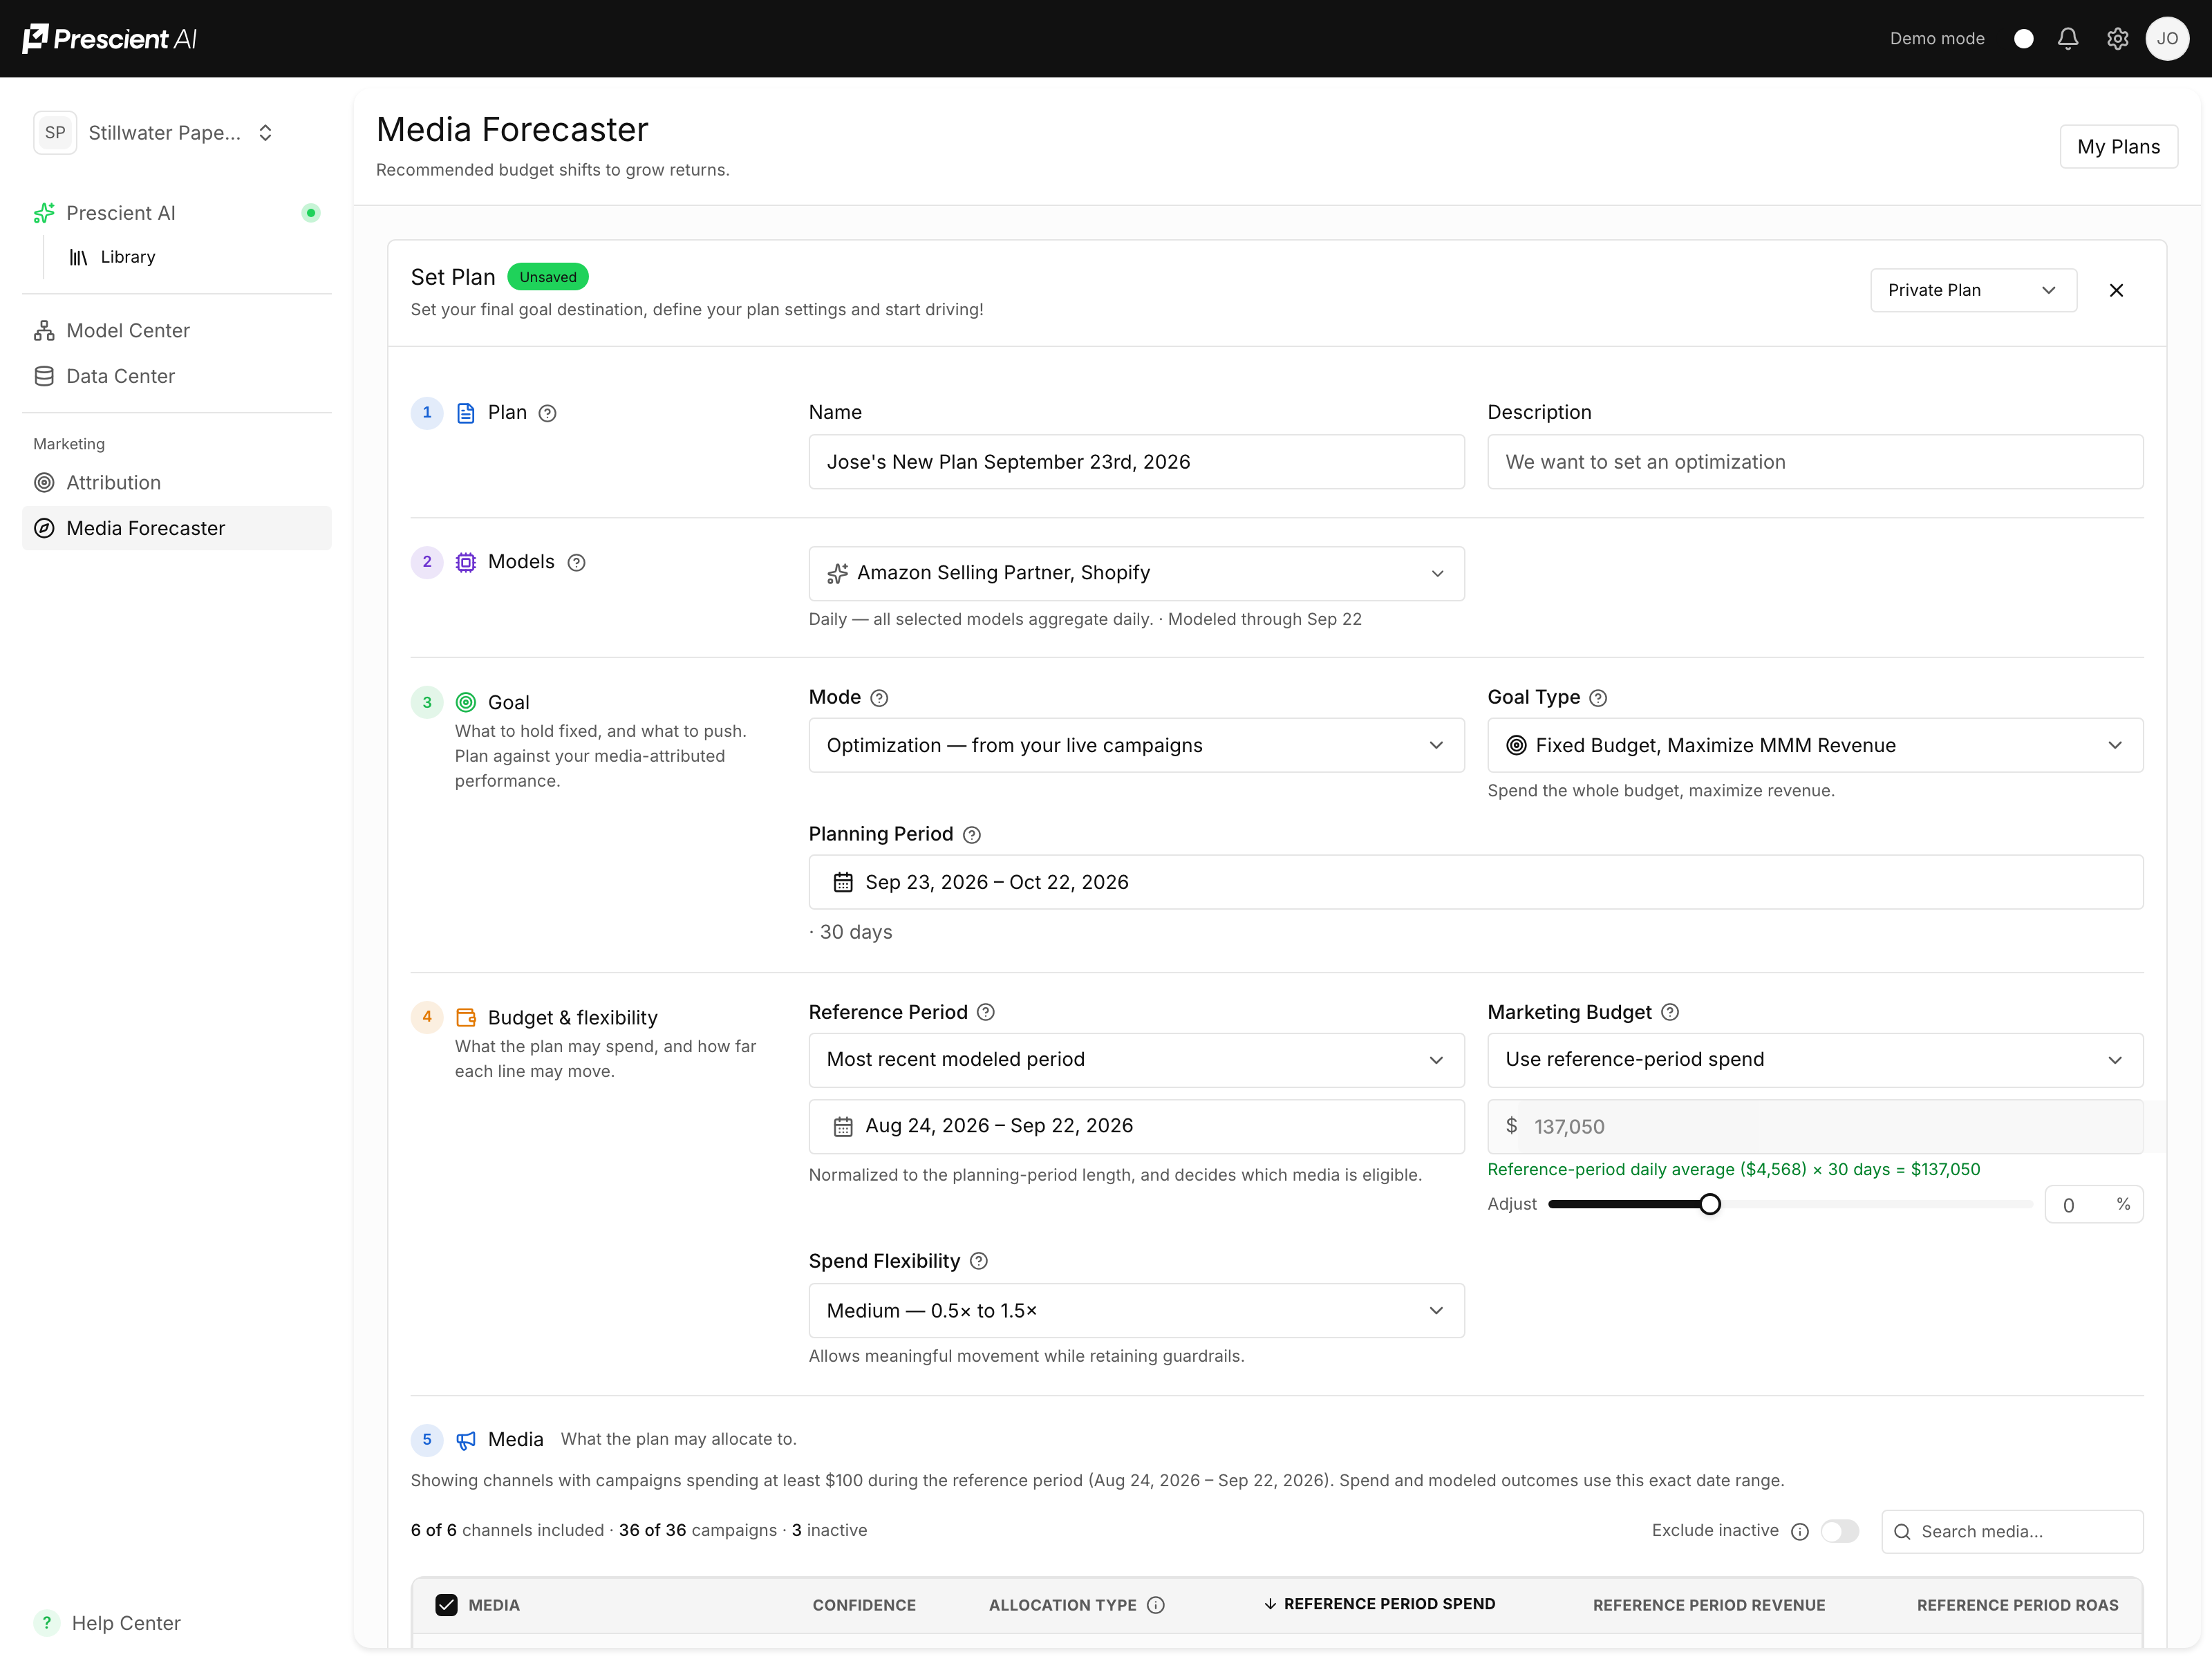
Name and Description
Give the plan a clear name that identifies its purpose and planning period.
For example:
- Q4 Revenue Growth Plan
- Holiday Media Forecast
- September Fixed-Budget Scenario
- 2027 Annual Media Plan
Use the description to record important context, assumptions, or goals.
Select a Goal
The goal determines what Prescient should optimize.
For a Fixed Budget, Maximize Revenue plan, Prescient distributes the available budget across the selected media to generate the greatest modeled media revenue.
The optimized allocation may not produce the highest possible ROAS for every individual channel. The objective is to maximize total modeled revenue across the complete plan.
Select Your Models
Choose the business outcome models that should be included in the forecast.
Models may represent different sources of revenue, such as:
- Ecommerce stores
- Retail partners
- Marketplaces
- Social commerce platforms
- Direct-to-consumer revenue
A single media investment may influence several of these outcomes. By including multiple models, the Media Forecaster can evaluate the expected impact of media across the wider business rather than optimizing for only one storefront.
The selected models are shown at the top of the finished plan.
Choose a Planning Period
Select the future period the plan should cover.
You can use a predefined duration or enter custom dates.
The planning period determines:
- The total time covered by the forecast
- The historical baseline used for comparison
- The expected weekly or daily media performance
- When actual performance begins appearing in the plan
Longer planning periods may include more seasonal variation than shorter plans.
Set the Marketing Budget
Enter the total media budget available for the planning period.
Depending on the available options, you may begin with:
- Average recent spend
- A custom budget
- Another suggested historical reference
Prescient displays the calculation used to create the suggested budget so you can review it before running the plan.
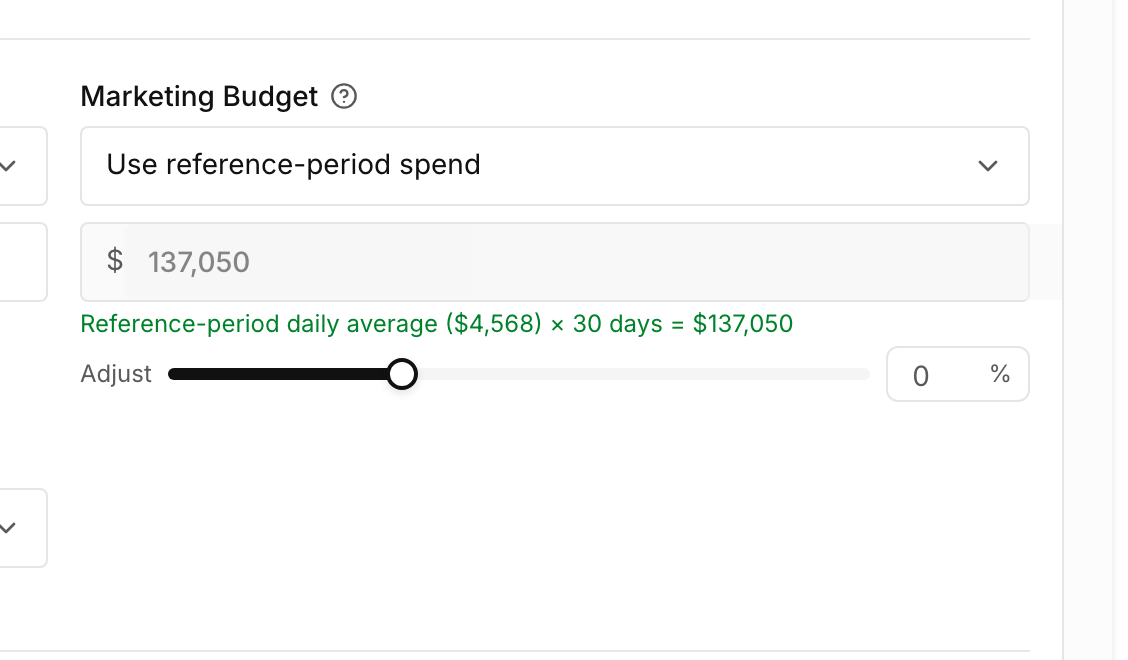
Adjusting the Budget by Percentage
Rather than typing a new figure, you can change the plan budget by a percentage of
itself using the Adjust slider on the Marketing Budget row — or type the
percentage straight into the % box beside it.
This is the quickest way to answer "what does 10% more spend buy me" — set the
percentage, and the budget updates for you to run.
Optimization or Forecast: which to use
These answer different questions. Neither is a basic or advanced version of the other — pick by whether the campaigns you are planning already exist.
| Optimization | Forecast | |
|---|---|---|
| Answers | "How should we divide this budget across the campaigns we are running?" | "What could this future period look like, and what would it take?" |
| Plans at | Campaign level | Tactic level |
| Best for | Near-term execution | Longer-range, seasonal and scenario planning |
| Assumes | The campaigns in your reference period are a useful picture of what you will run | The future may use more, fewer or different campaigns |
| Spend limits apply around | Each campaign's baseline | Each tactic's baseline |
| You get | Detailed campaign allocations | Tactic allocations and a future view |
Choose Optimization when the period is near term, most campaigns that will receive budget already exist, and campaign minimums, maximums or fixed amounts matter. It respects campaign-level guardrails, which is what makes it usable for execution — but it also means the campaign list matters, so check it before running.
Choose Forecast when you are planning a future quarter or seasonal event, the number or mix of campaigns will change, or you want to compare budget scenarios. It plans at tactic level, which is what makes it useful before the final campaign roster exists.
The quick ruleA change in campaign structure points to Forecast. How far each line may move is a separate decision — see Spend Flexibility.
Select Included Media
Choose the channels and tactics that Prescient should include in the optimization.
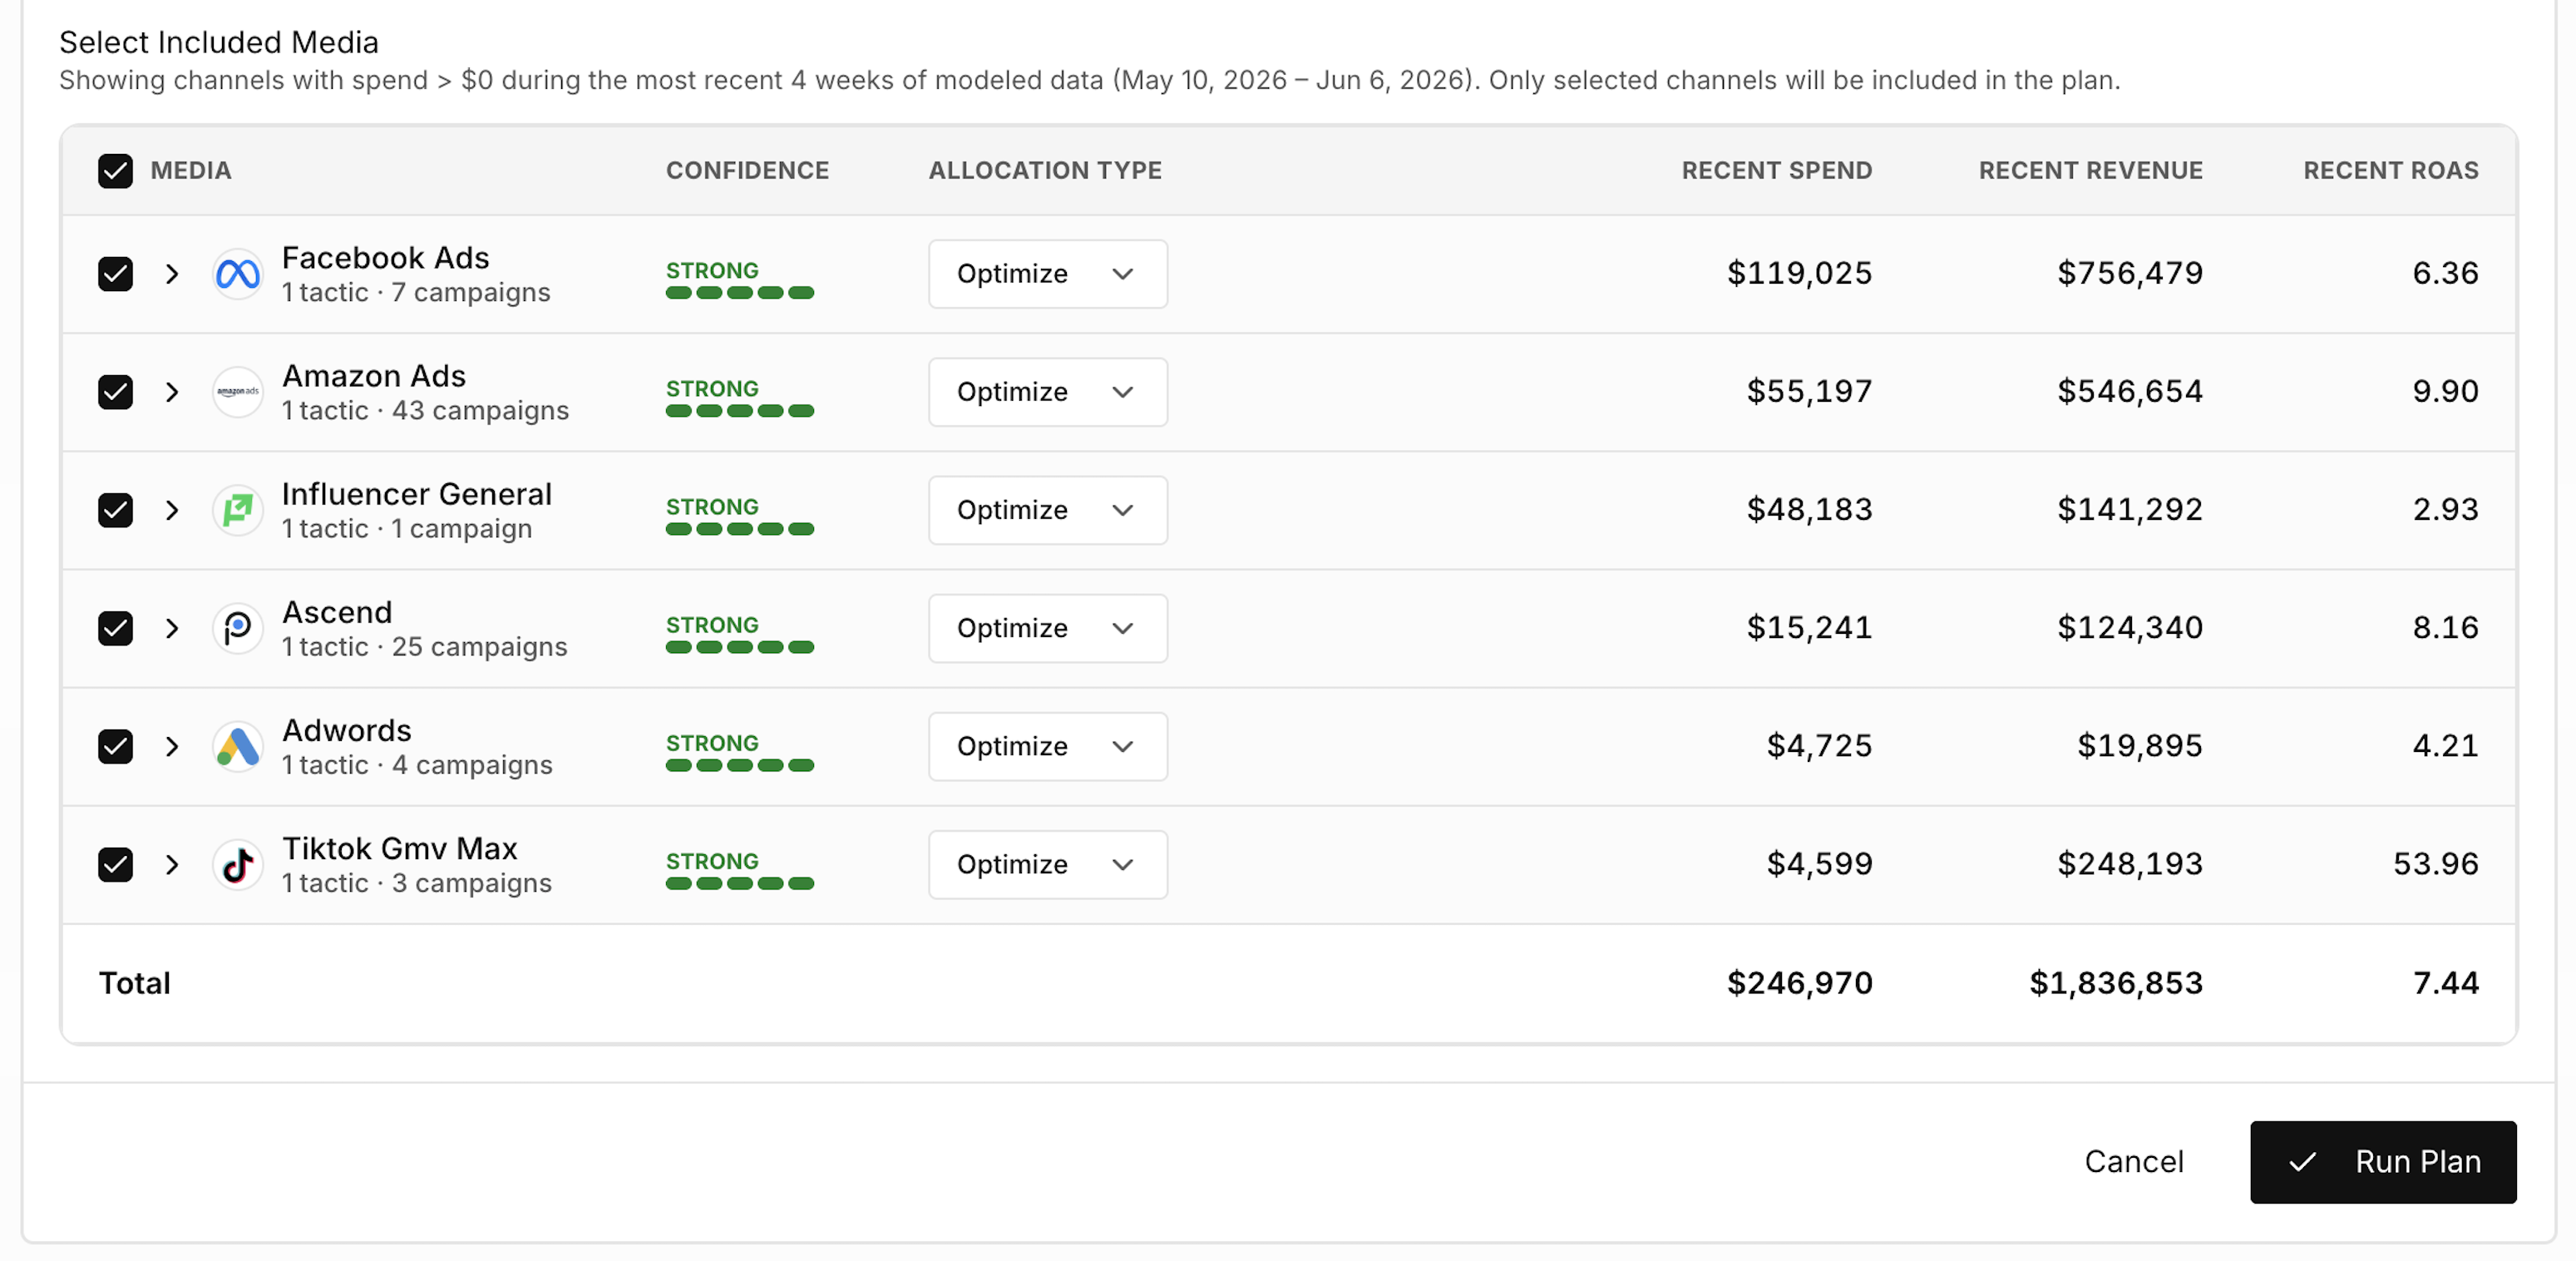
The table displays information such as:
- Media channel
- Included tactics and campaigns
- Forecast confidence
- Optimization setting
- Recent spend
- Recent modeled revenue
- Recent modeled ROAS
Only selected media will be included in the plan.
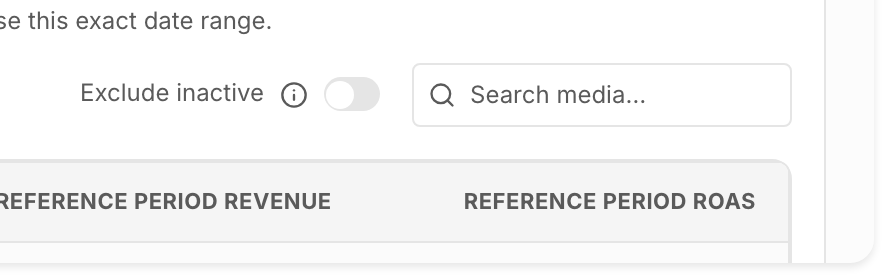
Excluding Inactive Media
Media plans often carry campaigns that have effectively stopped spending. Turn on Exclude inactive,
above the media list, and Prescient leaves those out of the plan, so the
optimization works with the media you are actually running.
Optimization Type
For each channel or tactic, choose how it should be treated.
Optimize
Prescient can increase or decrease the allocation based on expected performance.
Other available controls may allow you to preserve or constrain selected investments, depending on your account configuration.
Use these controls when a channel has:
- A contractual commitment
- A minimum required investment
- A strategic test
- A fixed sponsorship
- Inventory or audience limitations
- Another business requirement
Confidence
Confidence indicates how strongly the underlying models support the media forecast.
A channel can contribute to several revenue models. Prescient displays confidence across the applicable models so you can understand the strength of the forecast across the business.
Select or hover over the confidence indicator to review confidence by model.
For example, a channel may have strong confidence across Shopify, Amazon, Sephora, and retail models.
Higher confidence generally means the models have stronger historical evidence for estimating how the channel responds to spend changes.
Confidence should be considered alongside business context. It is not a guarantee that the forecasted result will occur.
Bounding what a row can get
Each media row chooses how the optimizer may treat it. The Baseline Spend column shows the row's starting point: its share of reference-period spend, applied to your plan budget.
| Mode | What the optimizer does |
|---|---|
| Optimize | Allocates freely, within the plan's overall budget. The default. |
| Max spend | Keeps optimizing, but holds the row under a ceiling. |
| Min spend | Keeps optimizing, but holds the row above a floor. |
| Fixed | Pins the row at the amount you enter and takes it out of the optimization. |
Enter any of them in dollars or as a % of the row's baseline.
Why a percentage is often the better choiceA percentage follows the baseline. If you change the plan budget, or change which media is included, a row set to "150% of baseline" stays at 150% of its new baseline — while a row set to a dollar figure stays at that figure and quietly becomes a different share of the plan.
Use a minimum where you have a commitment you cannot walk away from — a signed insertion order, an always-on brand channel. Use a maximum where a channel cannot absorb more spend in practice, however attractive the model finds it: inventory limits, agency capacity, a platform that will not deliver more. Use Fixed when the amount is already decided and you only want the rest of the plan optimized around it.
Bounds constrain the optimizer; they do not tell it what to do. A row with a maximum may still receive less than that maximum if the model sees better returns elsewhere.
Duplicating a Plan
A plan that has produced a result cannot be edited. Its numbers were produced by a
specific budget, date range and set of constraints, so changing those would
silently invalidate a result your team may already be working from.
To explore a variation, use Duplicate Plan. This creates a new plan carrying
the same settings, which you can then change freely before running it.
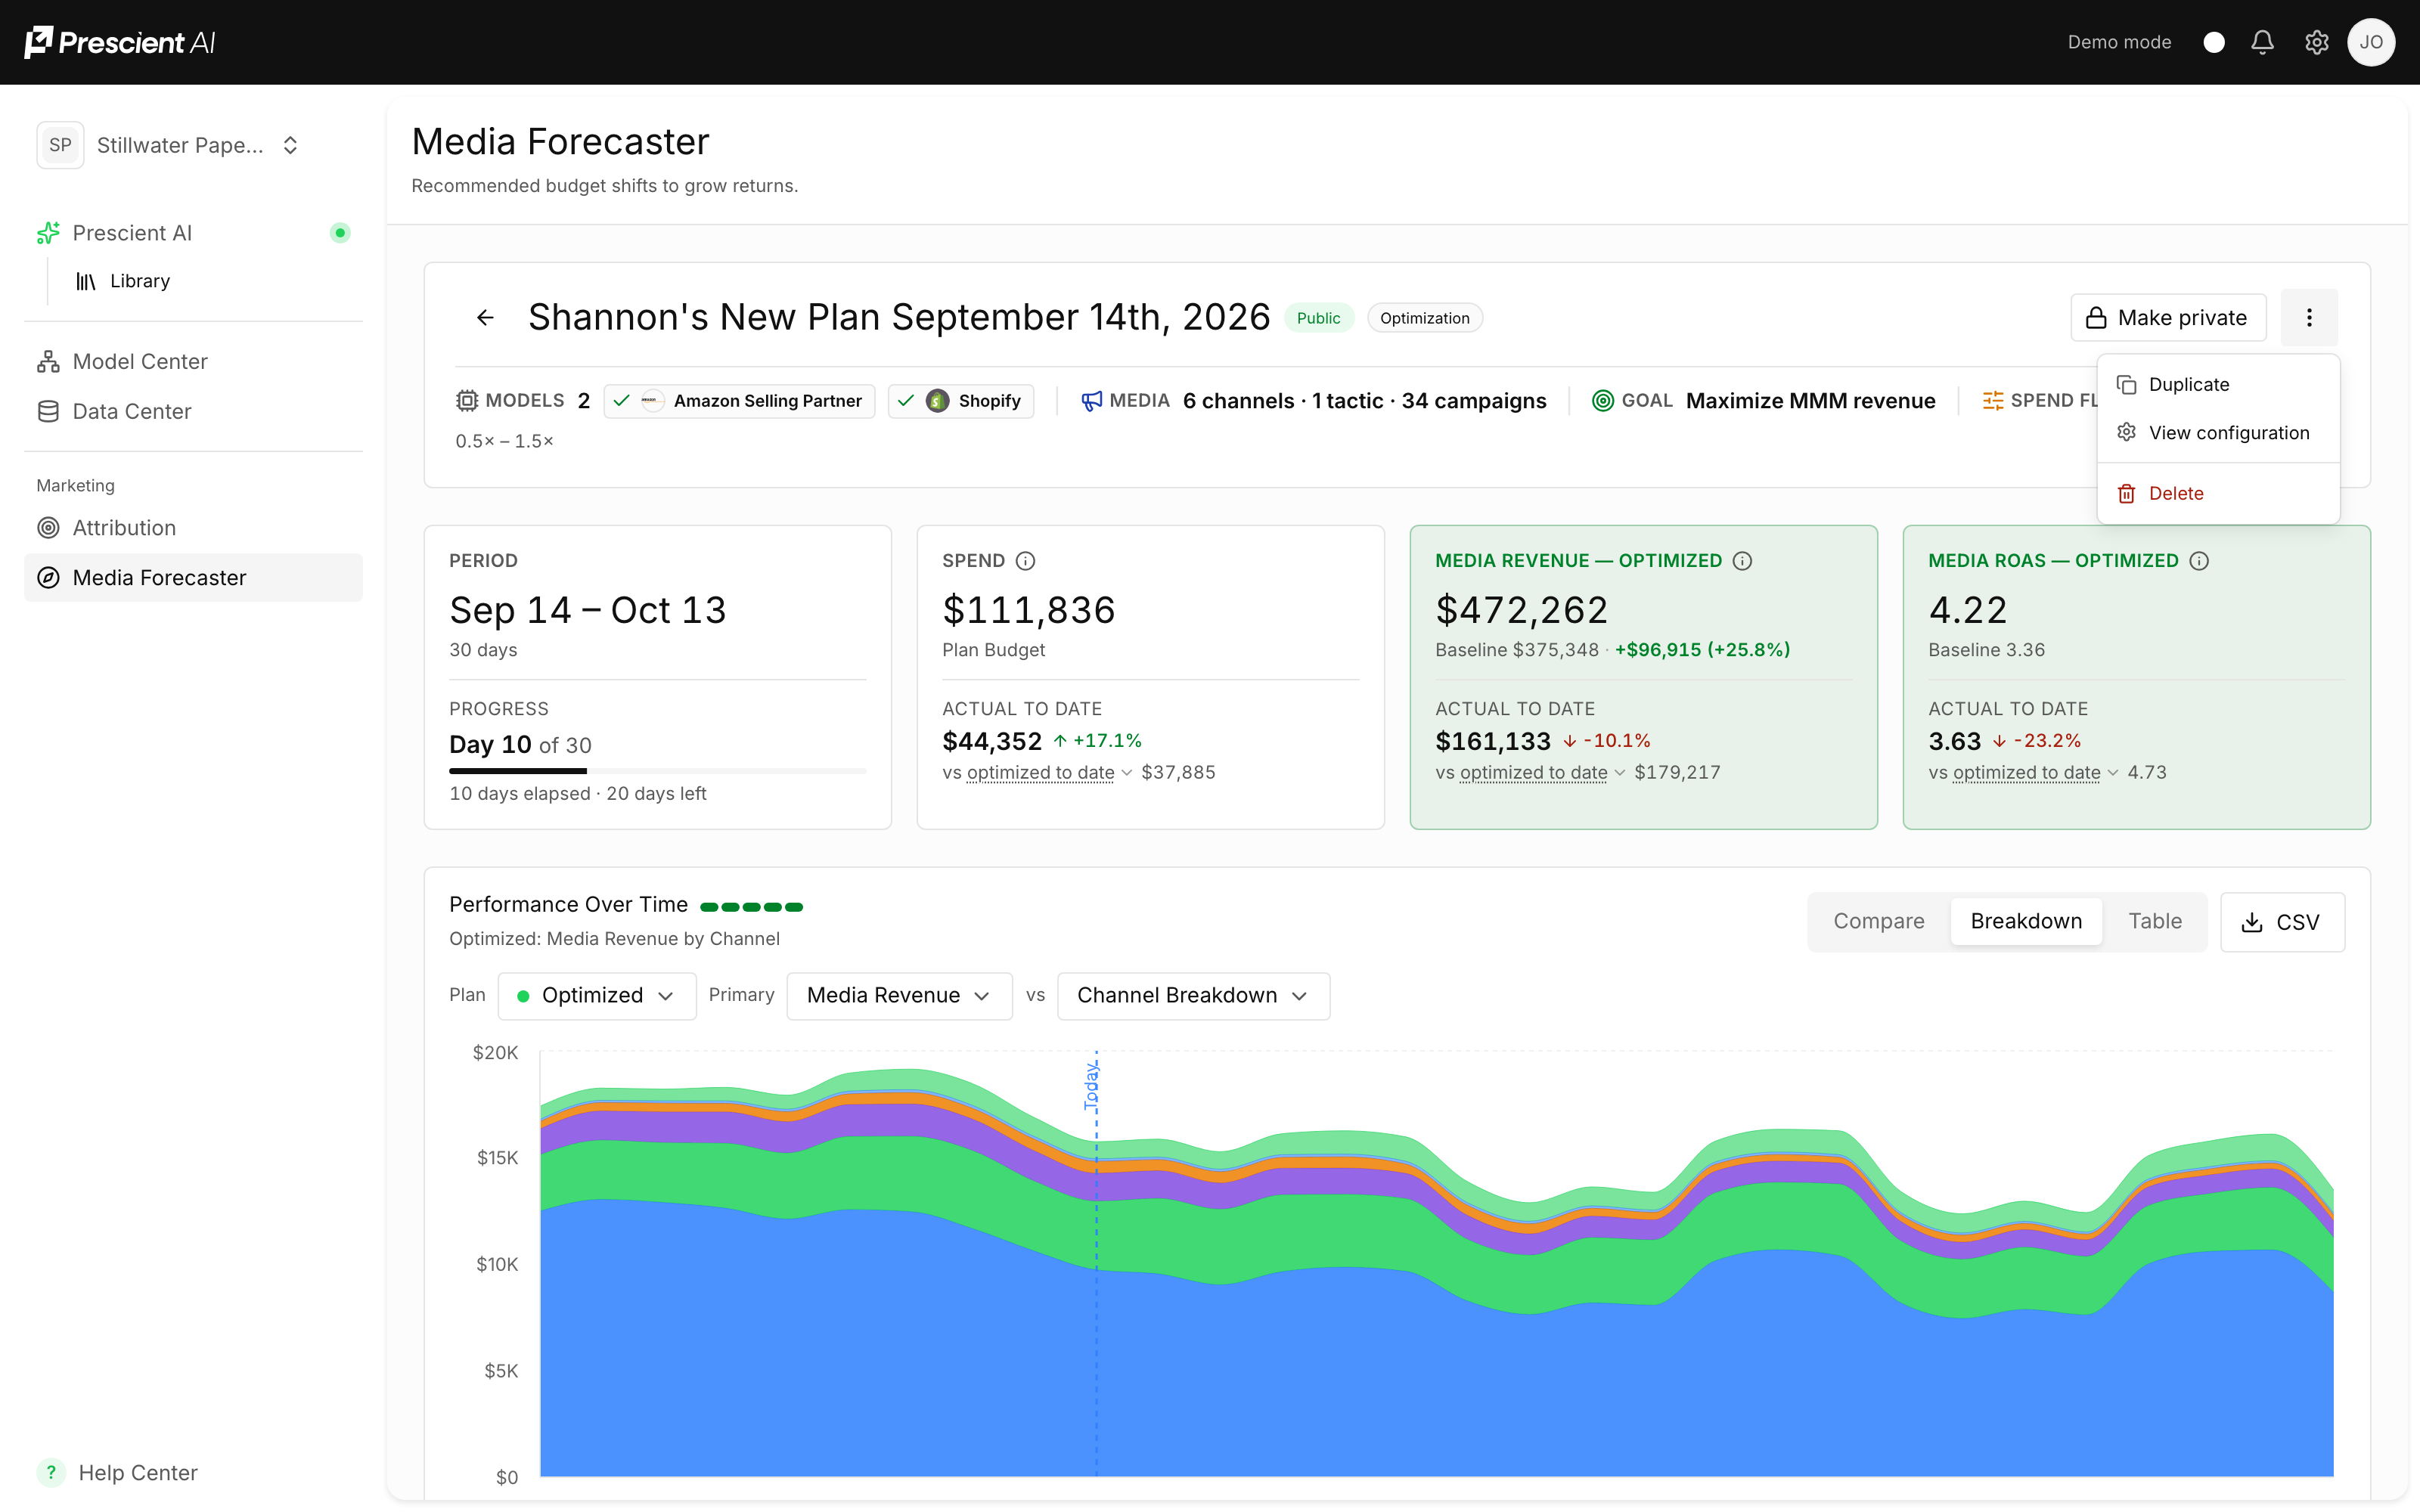
If you open a completed plan and try to change it, Prescient offers Duplicate to
edit — the same thing, offered where you noticed you needed it.
A plan that failed can be edited directly. There is no result to protect, so
you can correct whatever caused the failure and run it again rather than starting
over.
Read the result
What the plan is telling you, and which number answers which question.
Understanding the Completed Plan
When processing is complete, the plan opens to a summary of its objective, models, media scope, and forecasted outcome.
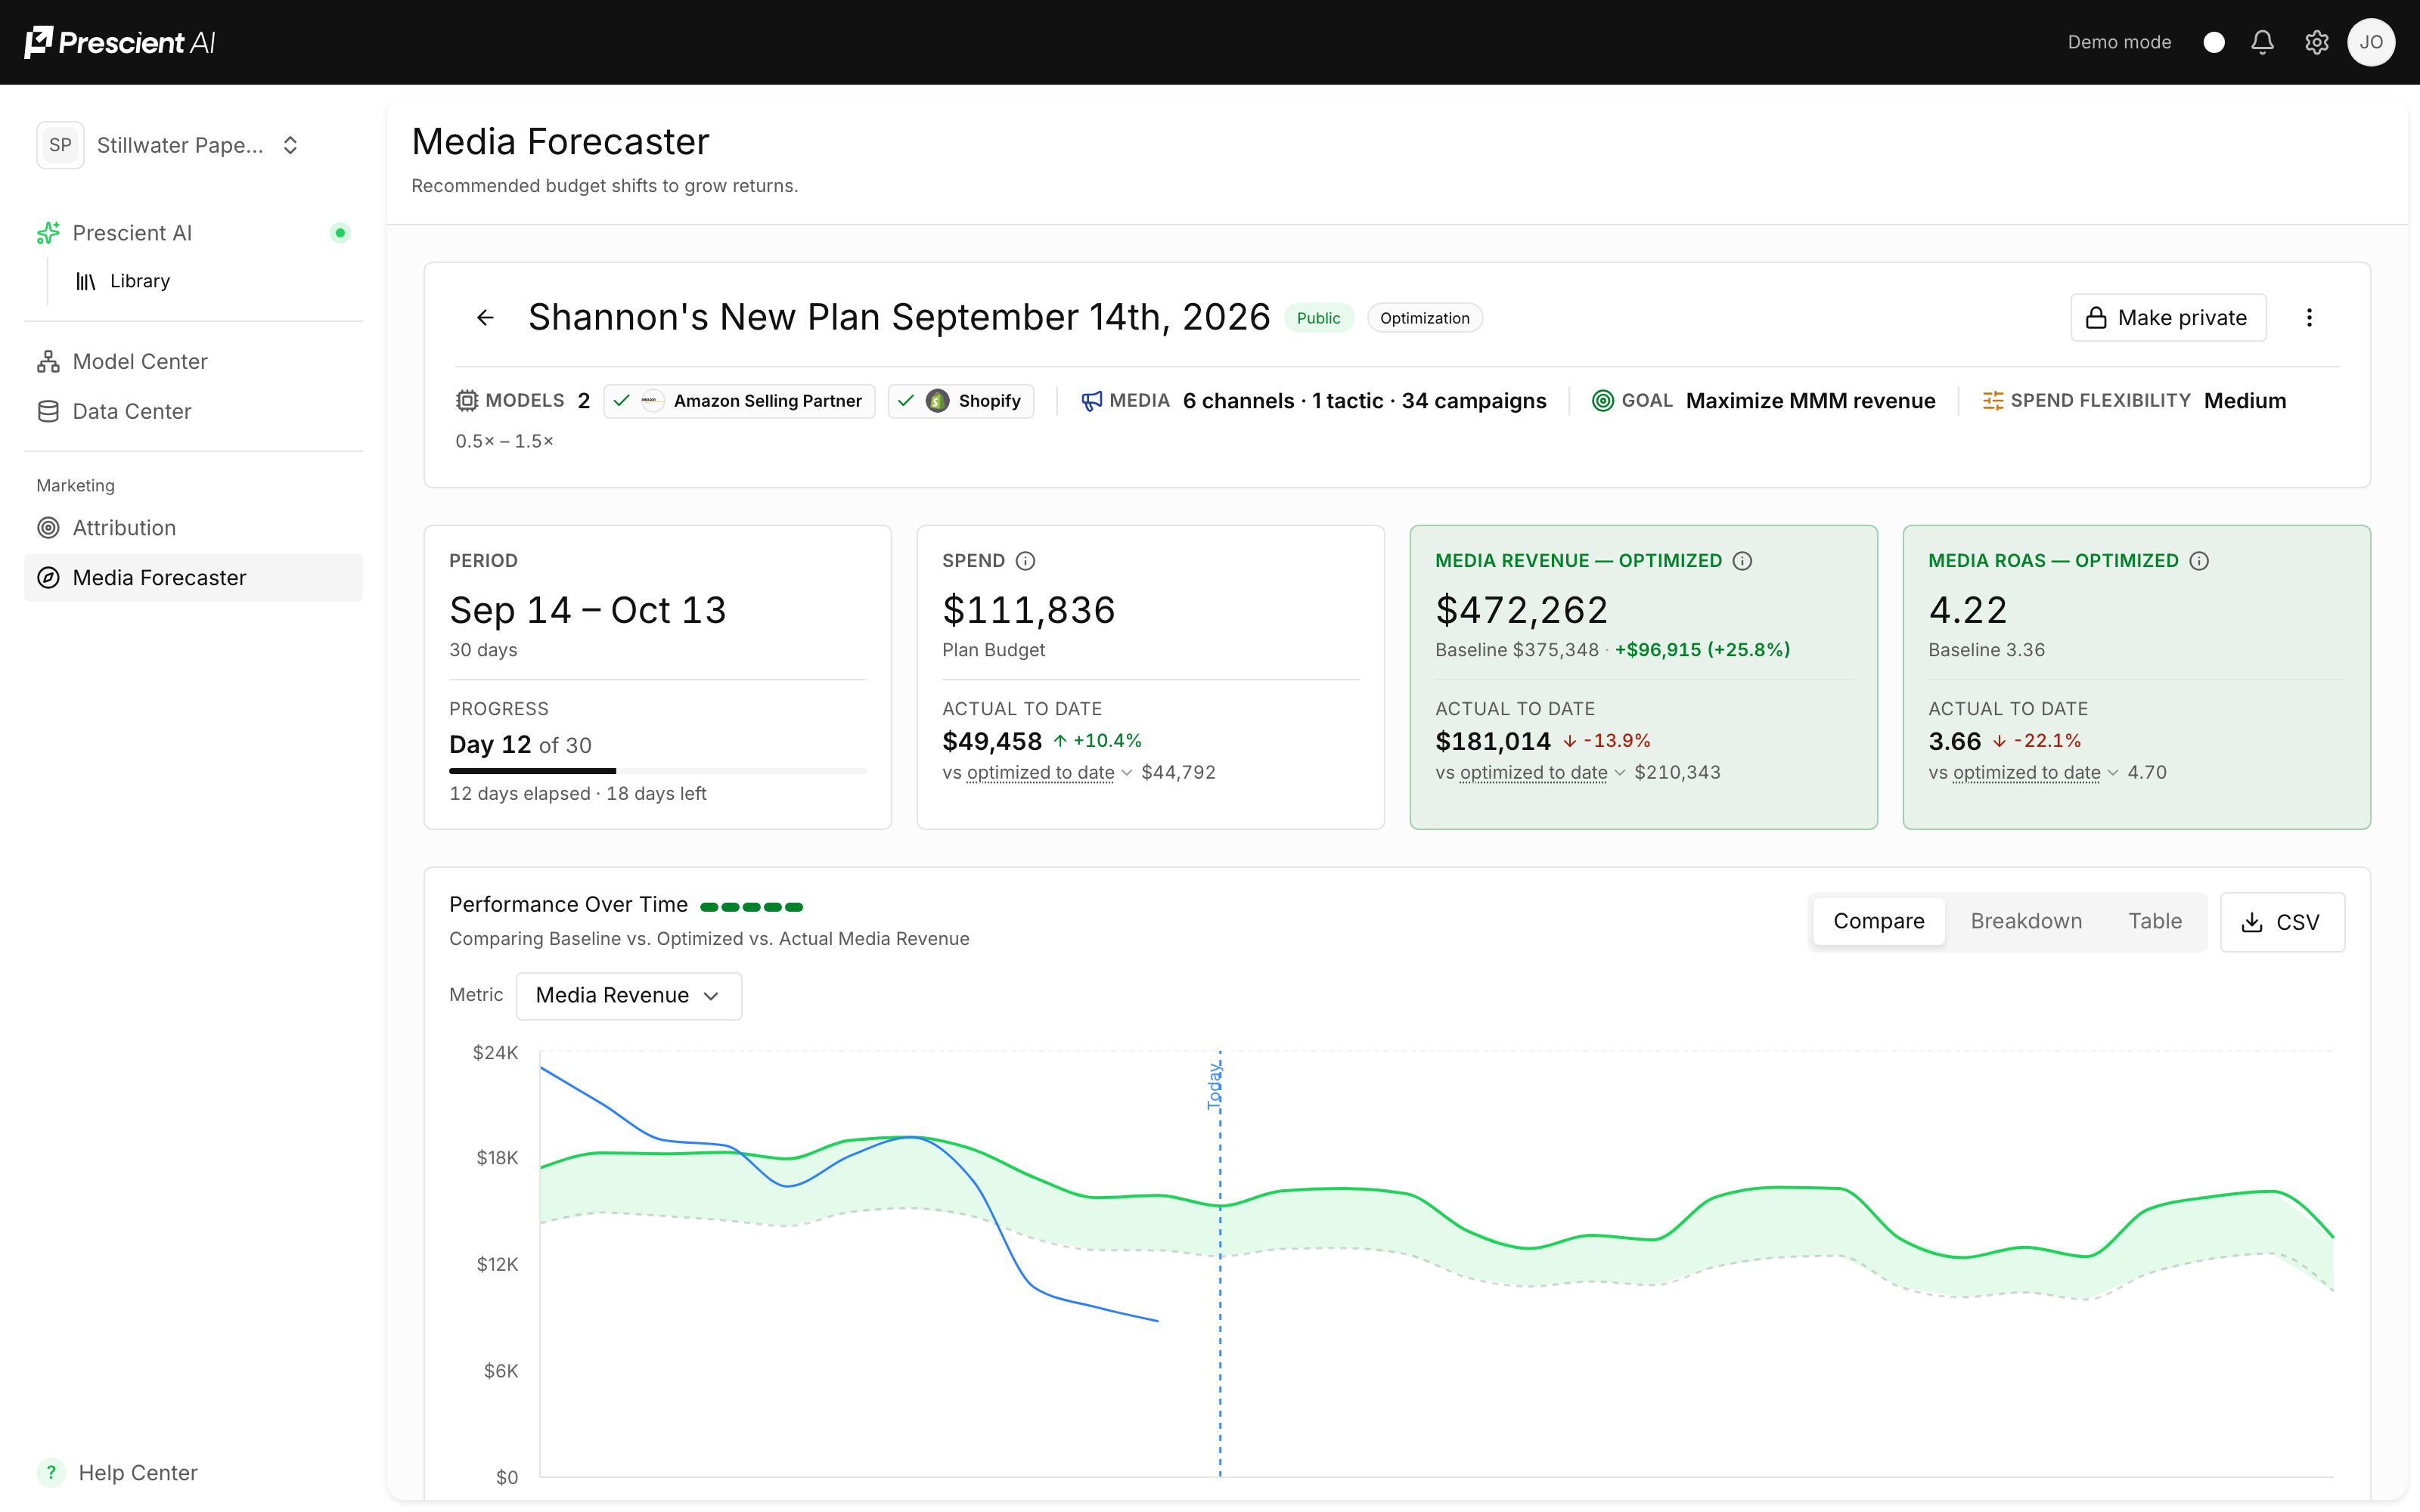
The header displays:
- Selected models
- Number of channels
- Number of tactics
- Number of campaigns
- Optimization goal
- Plan visibility
Plan Summary
The summary cards provide the most important information about the plan.

Planning Period
Shows the start and end dates, total number of weeks, and current progress.
After the plan begins, it also shows:
- Current week
- Weeks elapsed
- Weeks remaining
Spend
Shows the total planned marketing budget.
Once the plan is active, Actual to Date compares observed spend with the expected amount for the current point in the plan.
This helps identify whether the team is pacing above or below the forecasted allocation.
Optimized Media Revenue
Shows the total media revenue Prescient forecasts under the optimized allocation.
The card also compares the optimized result with the baseline.
For example:
- Baseline media revenue
- Optimized media revenue
- Forecasted revenue lift
- Percentage improvement
After the plan begins, Actual to Date shows observed modeled revenue compared with the expected optimized result.
Optimized Media ROAS
Shows the forecasted media ROAS for the optimized plan.
It is compared with baseline ROAS so you can understand whether the recommended allocation is expected to improve overall efficiency.
Actual-to-date ROAS becomes available as spend and modeled revenue are observed.
Baseline, Optimized, and Actual to Date
The Media Forecaster compares different views of your media plan:
- Baseline — what this period is modeled to deliver if you keep spending the way you do today.
- Optimized — what this period is modeled to deliver if you reallocate the same budget based on Prescient's recommendations.
- Actual to Date — what your reporting has actually recorded so far.
- Expected to Date — what the plan expected to deliver by this point in the period, based on the plan's actual pacing and shape.
Baseline
The baseline answers the question:
“What would happen if I changed nothing about my current media allocation?”
The baseline uses the same planning period and total budget as the optimized plan. The difference is how that budget is allocated: the baseline maintains the current campaign spending pattern, while the optimized plan reallocates the budget based on Prescient's recommendations.
How Baseline Is Calculated
The baseline calculation has two separate parts:
- Baseline Spend — determines how much each campaign is expected to spend during the planning period based on current spending levels.
- Baseline Performance — uses the same MMM methodology as the optimized plan to forecast revenue and new customers from that spend.
1. Baseline Spend
Prescient calculates the average spend for each campaign during the reference period. The spending cadence is based on the aggregation used by the selected model (for example, daily or weekly).
For a model using daily aggregation, Prescient calculates the reference-period daily average and projects it across the selected planning period:
Baseline Campaign Spend = Reference-Period Daily Average Campaign Spend × Number of Days in the Planning Period
Example
Suppose the selected model uses daily aggregation.
During the reference period, the average daily campaign spend is $313,670.
For a 92-day planning period:
$313,670 × 92 days = $28,857,640
This projected spend represents the baseline: what would be spent during the planning period if the current spending level continued.
If the model uses a different aggregation, such as weekly, the same calculation is applied using that period:
Baseline Campaign Spend = Reference-Period Average Campaign Spend × Number of Reference Periods in the Planning Period
2. Baseline ROAS
Baseline ROAS measures modeled revenue efficiency against media spend.
The revenue is the modeled Base + Halo revenue generated by the baseline allocation.
Baseline ROAS = Modeled Base + Halo Revenue ÷ Baseline Media Spend
Example
If the baseline allocation results in:
- Baseline Media Spend: $28.86M
- Modeled Base + Halo Revenue: $65.4M
Then:
Baseline ROAS = $65.4M ÷ $28.86M = 2.27x
This means that for every $1 of media spend, the baseline is modeled to generate $2.27 of Base + Halo revenue.
3. Baseline CAC
Baseline CAC measures modeled new customer efficiency against media spend.
The new customers are the modeled Base + Halo new customers generated by the baseline allocation.
Baseline CAC = Baseline Media Spend ÷ Modeled Base + Halo New Customers
Example
If the baseline allocation results in:
- Baseline Media Spend: $28.86M
- Modeled Base + Halo New Customers: 480,000
Then:
Baseline CAC = $28.86M ÷ 480,000 = $60.13
This means the baseline is modeled to spend approximately $60.13 in media for each new customer.
Optimized
The optimized plan shows what Prescient expects to happen if you reallocate the same total budget based on the optimization recommendations.
The optimized plan uses the same:
- Total budget
- Planning period
- Models
- Media
- Goal
- Constraints
The key difference is how the budget is distributed across campaigns.
For example:
| Campaign | Baseline | Optimized |
|---|---|---|
| Campaign A | $120K | $150K |
| Campaign B | $80K | $60K |
| Campaign C | $40K | $30K |
| Total Spend | $240K | $240K |
The total budget remains the same, but the optimized plan changes where the budget is spent.
Prescient then models the expected revenue and new customer outcomes from the optimized allocation using the same MMM methodology.
Optimized ROAS
Optimized ROAS measures modeled revenue efficiency against media spend using the modeled Base + Halo revenue.
Optimized ROAS = Modeled Base + Halo Revenue ÷ Optimized Media Spend
Optimized CAC
Optimized CAC measures modeled new customer efficiency against media spend using the modeled Base + Halo new customers.
Optimized CAC = Optimized Media Spend ÷ Modeled Base + Halo New Customers
Actual to Date
Actual to Date shows what your reporting has actually recorded so far during the planning period.
As new data becomes available, actual spend and modeled performance are added to the plan.
You can use Actual to Date to compare:
- Planned spend vs. actual spend
- Forecasted revenue vs. modeled actual revenue
- Forecasted ROAS vs. actual modeled ROAS
- Expected pacing vs. actual implementation pacing
Expected to Date
Expected to Date represents the plan's own per-period expected values added up through today.
It follows the plan's actual shape rather than assuming that the total plan is distributed evenly across the planning period.
For example, if a plan is designed to spend more toward the end of the planning period, Expected to Date will reflect that ramp. This provides a more meaningful comparison against Actual to Date than simply dividing the full-period plan evenly across each day.
Interpreting Actual to Date
Actual-to-date results may initially appear significantly below the full-period baseline or optimized forecast because only part of the planning period has elapsed.
When comparing Actual to Date with the plan, use Expected to Date and the progress indicator to account for how much of the planning period has passed.
How the Views Work Together
| View | Question it answers |
|---|---|
| Baseline | What happens if I keep spending the way I do today? |
| Optimized | What could happen if I spend the same budget differently? |
| Expected to Date | What did the plan expect to happen by this point in time? |
| Actual to Date | What has actually happened so far? |
The Baseline and Optimized plans use the same total budget and planning period, so the comparison focuses on the expected impact of changing the media allocation, rather than simply spending more or less.
Baseline → Current allocation
Optimized → Recommended allocation
Expected to Date → Planned performance by today
Actual to Date → Observed performance so far
The key difference is how the budget is distributed across campaigns.
For example:
| Campaign | Baseline | Optimized |
|---|---|---|
| Campaign A | $120K | $150K |
| Campaign B | $80K | $60K |
| Campaign C | $40K | $30K |
| Total Spend | $240K | $240K |
The total budget remains the same, but the optimized plan changes where the budget is spent.
Prescient then models the expected revenue and new customer outcomes from the optimized allocation using the same MMM methodology.
Optimized ROAS
Optimized ROAS measures modeled revenue efficiency against media spend using the modeled Base + Halo revenue.
Optimized ROAS = Modeled Base + Halo Revenue ÷ Optimized Media Spend
Optimized CAC
Optimized CAC measures modeled new customer efficiency against media spend using the modeled Base + Halo new customers.
Optimized CAC = Optimized Media Spend ÷ Modeled Base + Halo New Customers
Actual to Date
Actual to Date shows what your reporting has actually recorded so far during the planning period.
As new data becomes available, actual spend and modeled performance are added to the plan.
You can use Actual to Date to compare:
- Planned spend vs. actual spend
- Forecasted revenue vs. modeled actual revenue
- Forecasted ROAS vs. actual modeled ROAS
- Expected pacing vs. actual implementation pacing
Expected to Date
Expected to Date represents the plan's own per-period expected values added up through today.
It follows the plan's actual shape rather than assuming that the total plan is distributed evenly across the planning period.
For example, if a plan is designed to spend more toward the end of the planning period, Expected to Date will reflect that ramp. This provides a more meaningful comparison against Actual to Date than simply dividing the full-period plan evenly across each day.
Interpreting Actual to Date
Actual-to-date results may initially appear significantly below the full-period baseline or optimized forecast because only part of the planning period has elapsed.
When comparing Actual to Date with the plan, use Expected to Date and the progress indicator to account for how much of the planning period has passed.
How the Views Work Together
| View | Question it answers |
|---|---|
| Baseline | What happens if I keep spending the way I do today? |
| Optimized | What could happen if I spend the same budget differently? |
| Expected to Date | What did the plan expect to happen by this point in time? |
| Actual to Date | What has actually happened so far? |
The Baseline and Optimized plans use the same total budget and planning period, so the comparison focuses on the expected impact of changing the media allocation, rather than simply spending more or less.
Baseline → Current allocation
Optimized → Recommended allocation
Expected to Date → Planned performance by today
Actual to Date → Observed performance so far
Performance Over Time
The Performance Over Time chart shows how results are expected to change throughout the planning period.
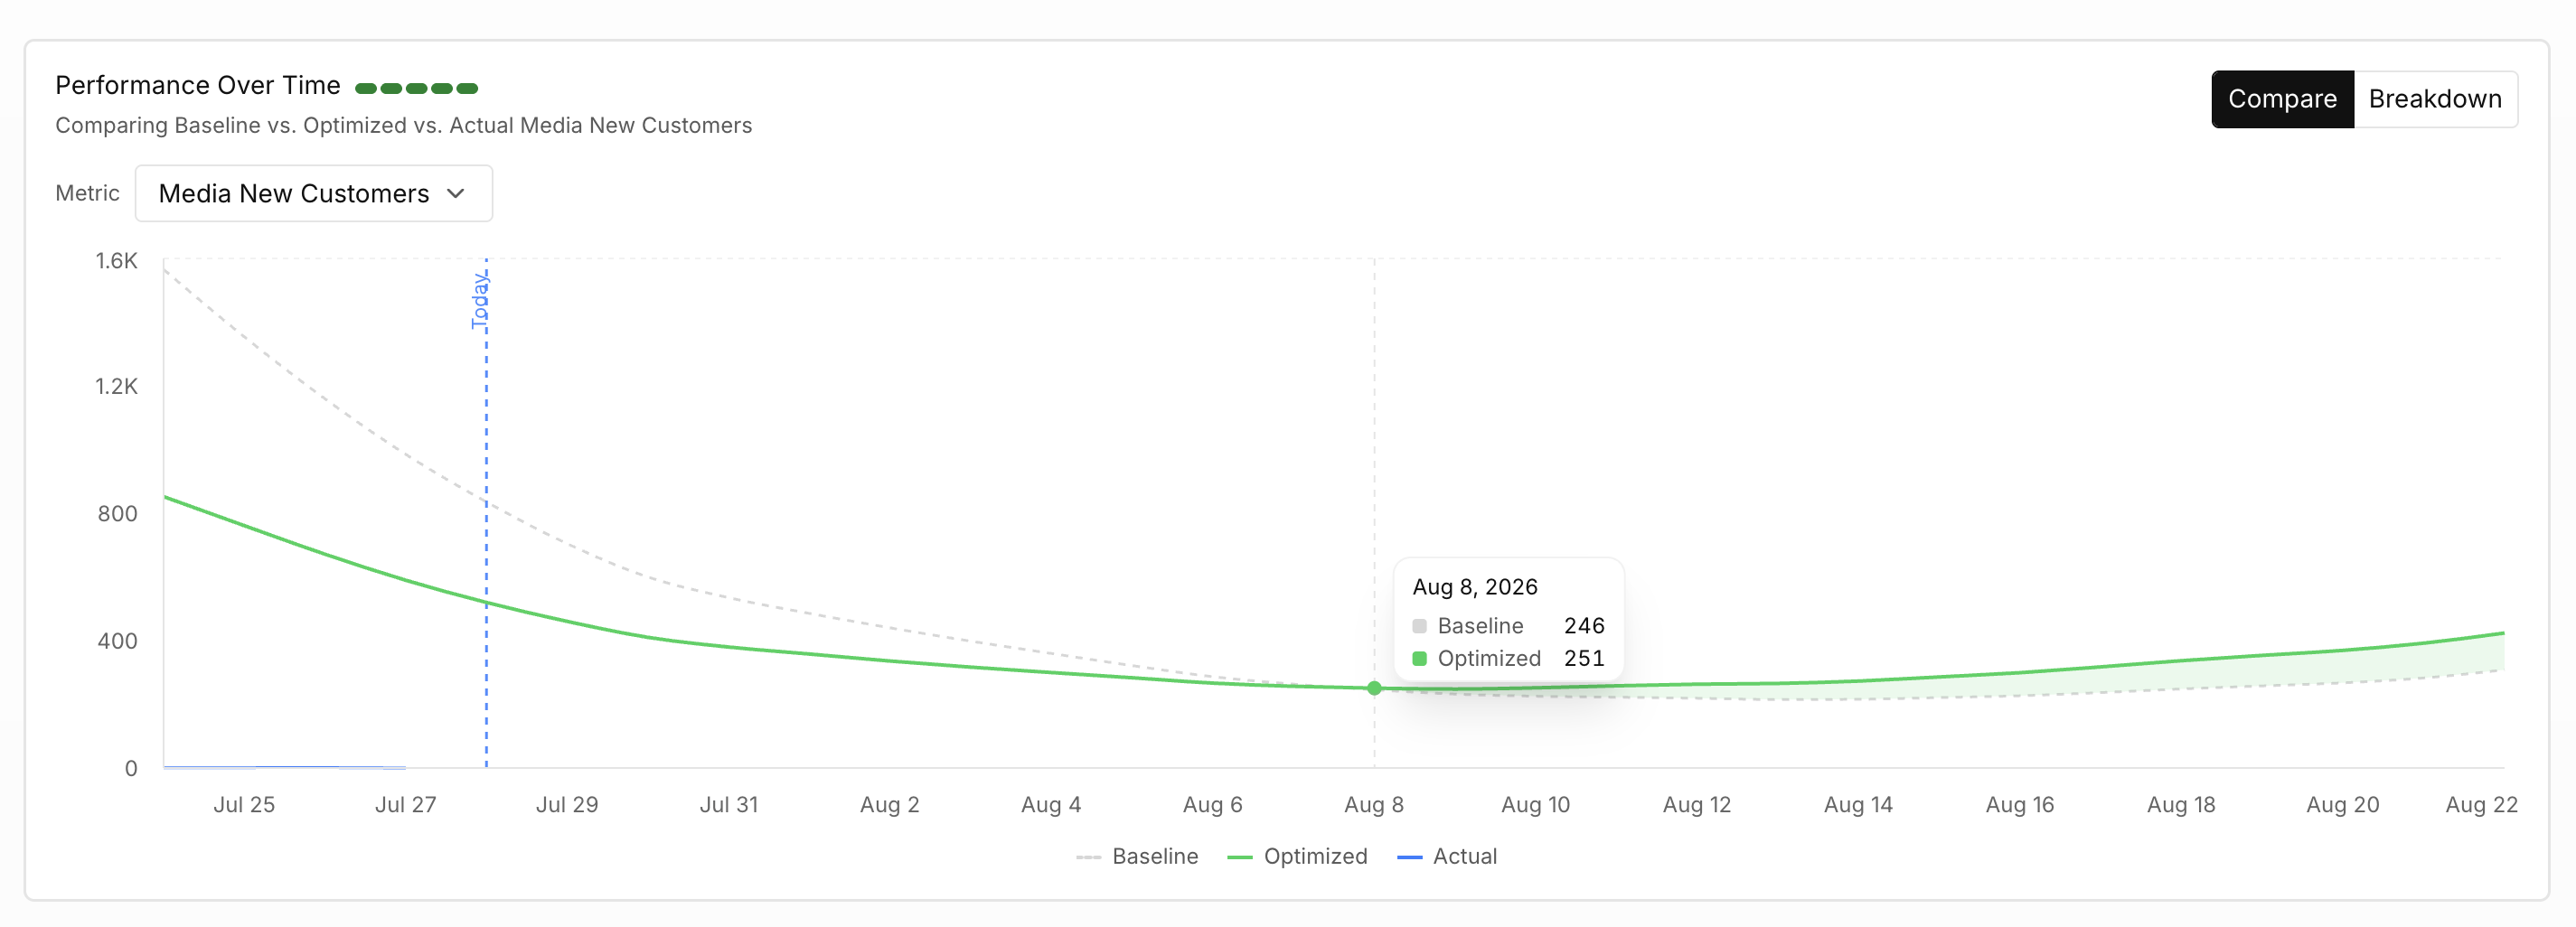
Use the metric selector to review available outcomes, such as:
- Media Revenue
- Media ROAS
- Spend
The chart may include:
- Baseline: Expected performance under the original allocation
- Optimized: Expected performance under Prescient’s recommended allocation
- Actual: Observed performance after the plan begins
Compare View
Use Compare to review baseline, optimized, and actual performance together.
This makes it easier to see the expected lift created by the optimized allocation.
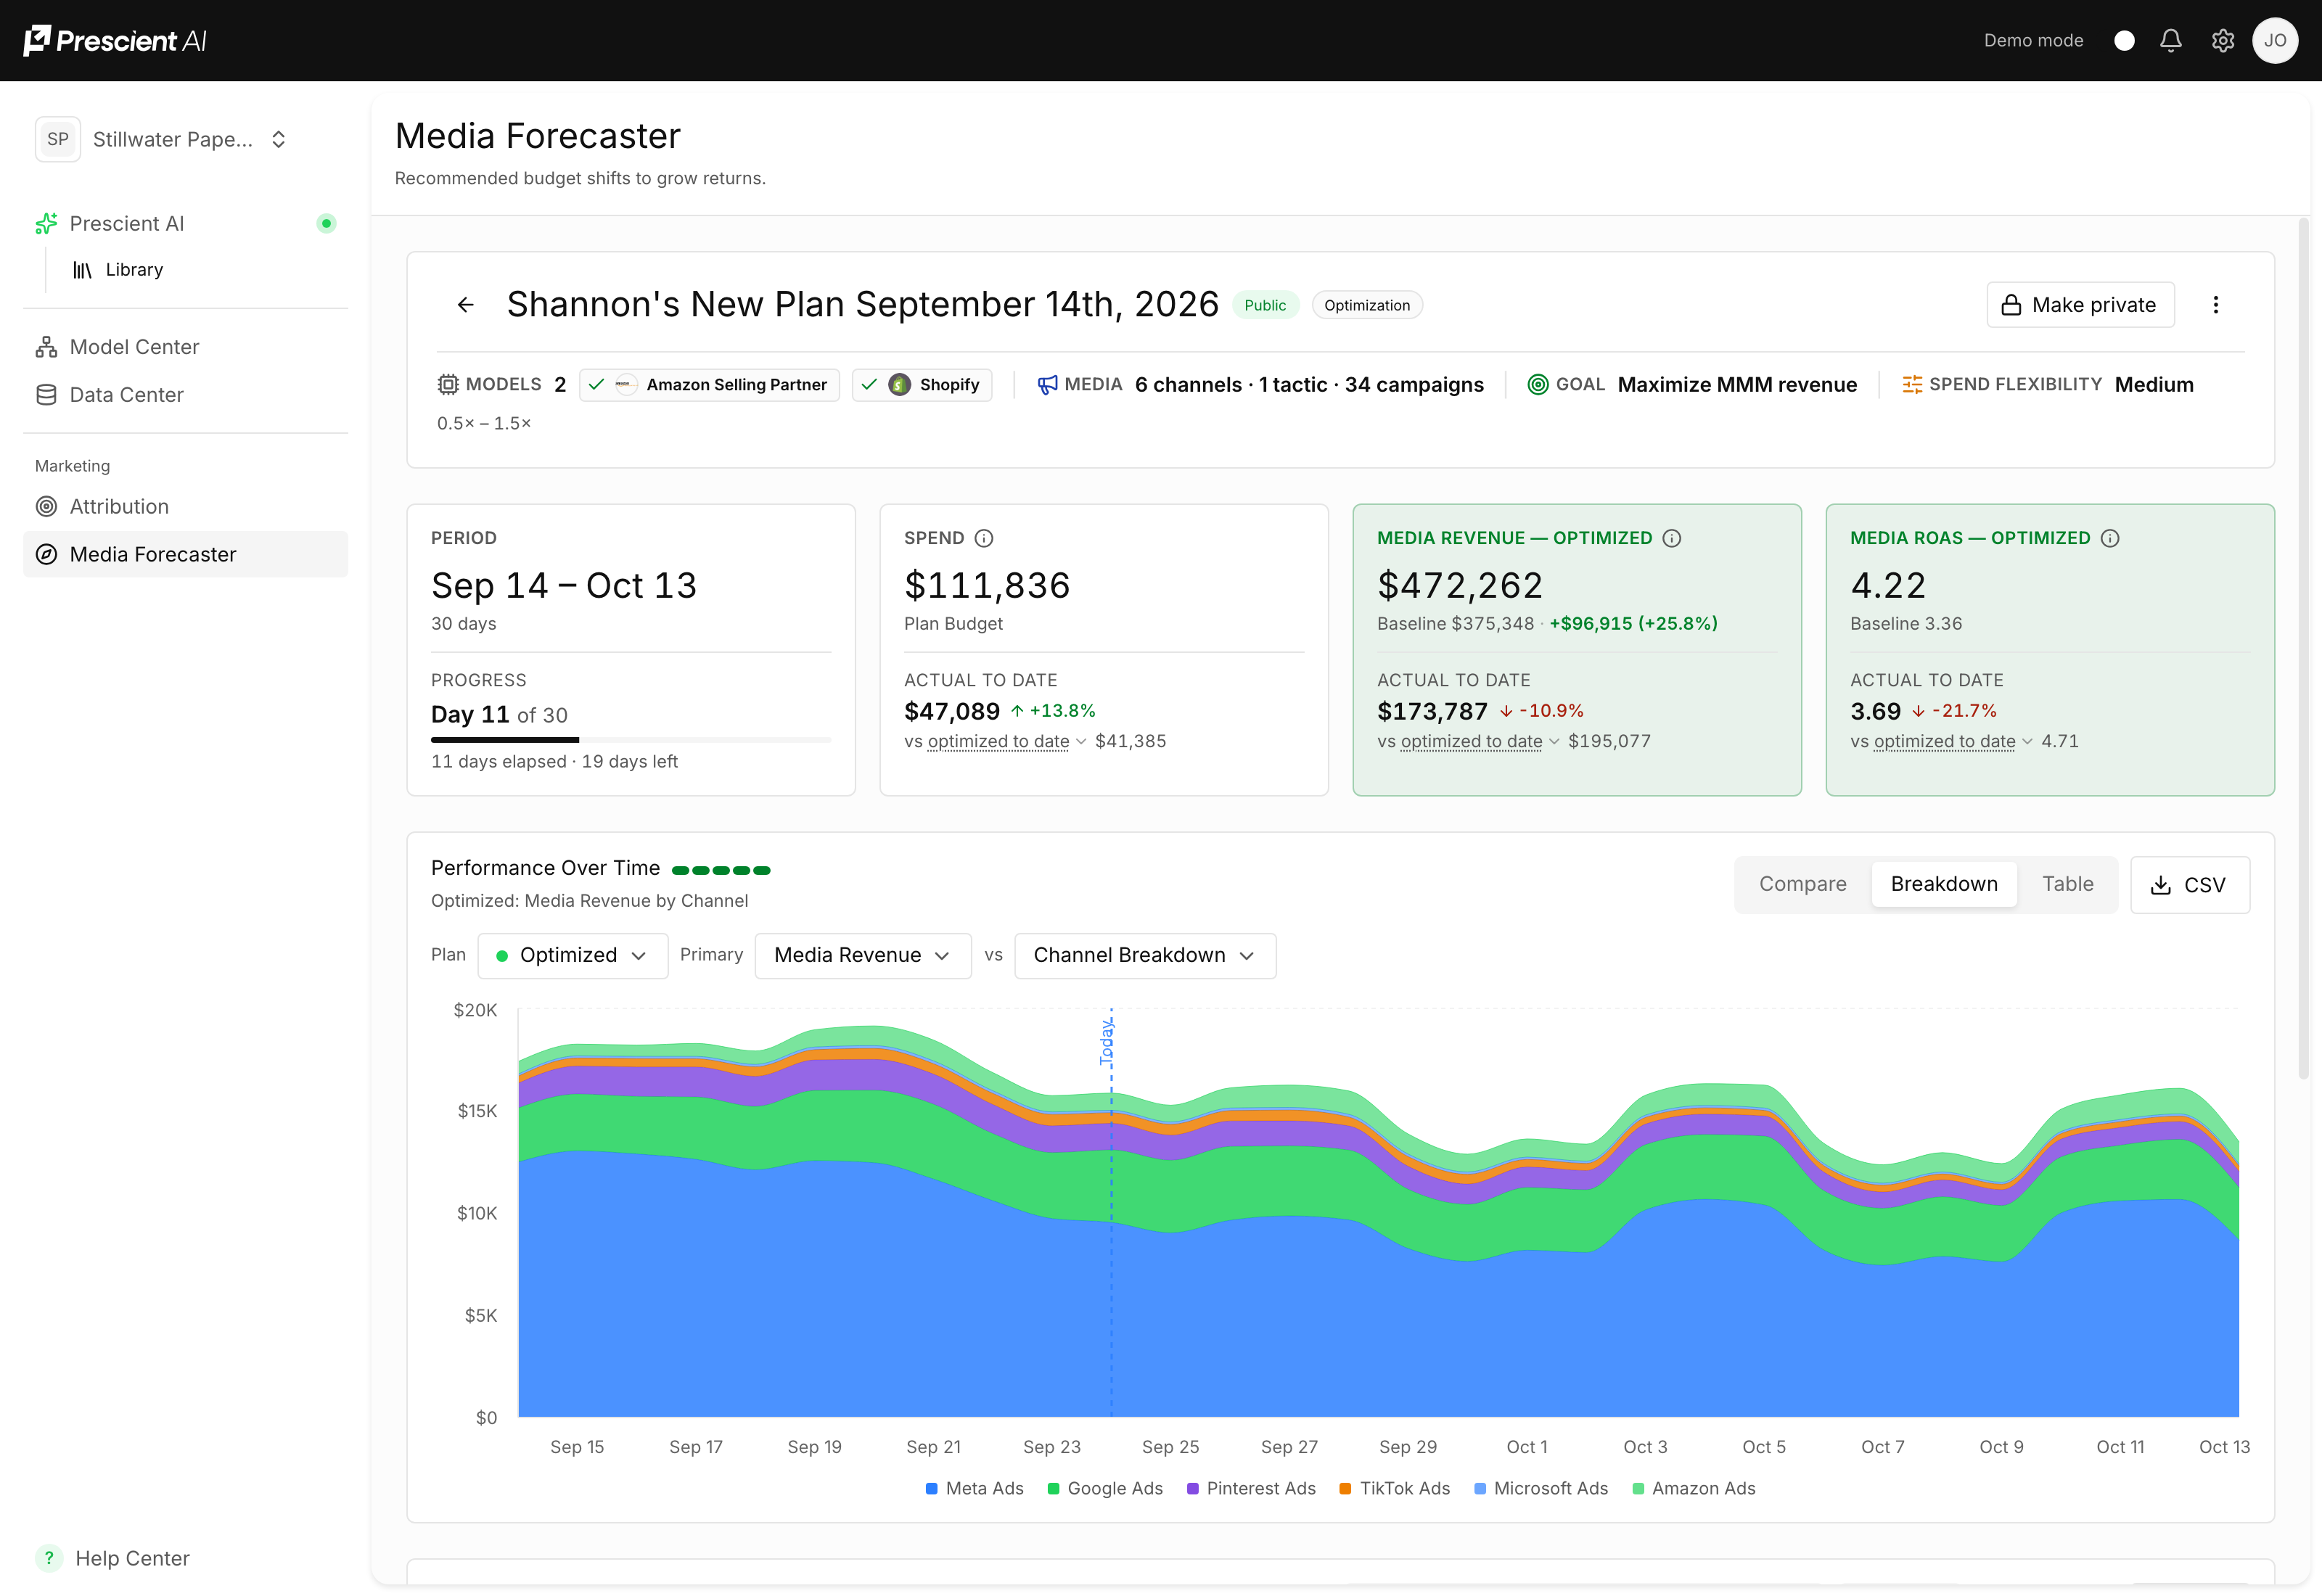
Breakdown View
Use Breakdown to explore how individual parts of the media mix contribute to the total plan.
The forecast can change over time because Prescient accounts for factors such as:
- Seasonal demand
- Historical media response
- Diminishing returns
- Different revenue models
- Changes in the selected media mix
Media Breakdown
The Media Breakdown table explains how the budget is distributed.
Review results by:
- Channel
- Tactic
For each row, Prescient compares three groups of metrics.
Baseline
- Spend
- Media revenue
- ROAS
Optimized
- Recommended spend
- Forecasted media revenue
- Forecasted ROAS
- Percentage change from baseline
Actual to Date
- Observed spend
- Modeled revenue
- Modeled ROAS
- Pacing compared with the plan
Green and red indicators show how optimized or actual values differ from the comparison point.
For example, Prescient may recommend:
- Increasing spend in a channel expected to produce more total revenue
- Reducing spend in a channel with weaker marginal returns
- Increasing revenue while accepting a lower ROAS
- Reducing spend while improving ROAS
- Maintaining an allocation that is already near its modeled optimum
The Allocation Column
Allocation shows what share of the plan's budget each row receives, so you can
read the shape of the plan without doing the arithmetic. The Total row at the
top of the table carries the same figures summed across every row.
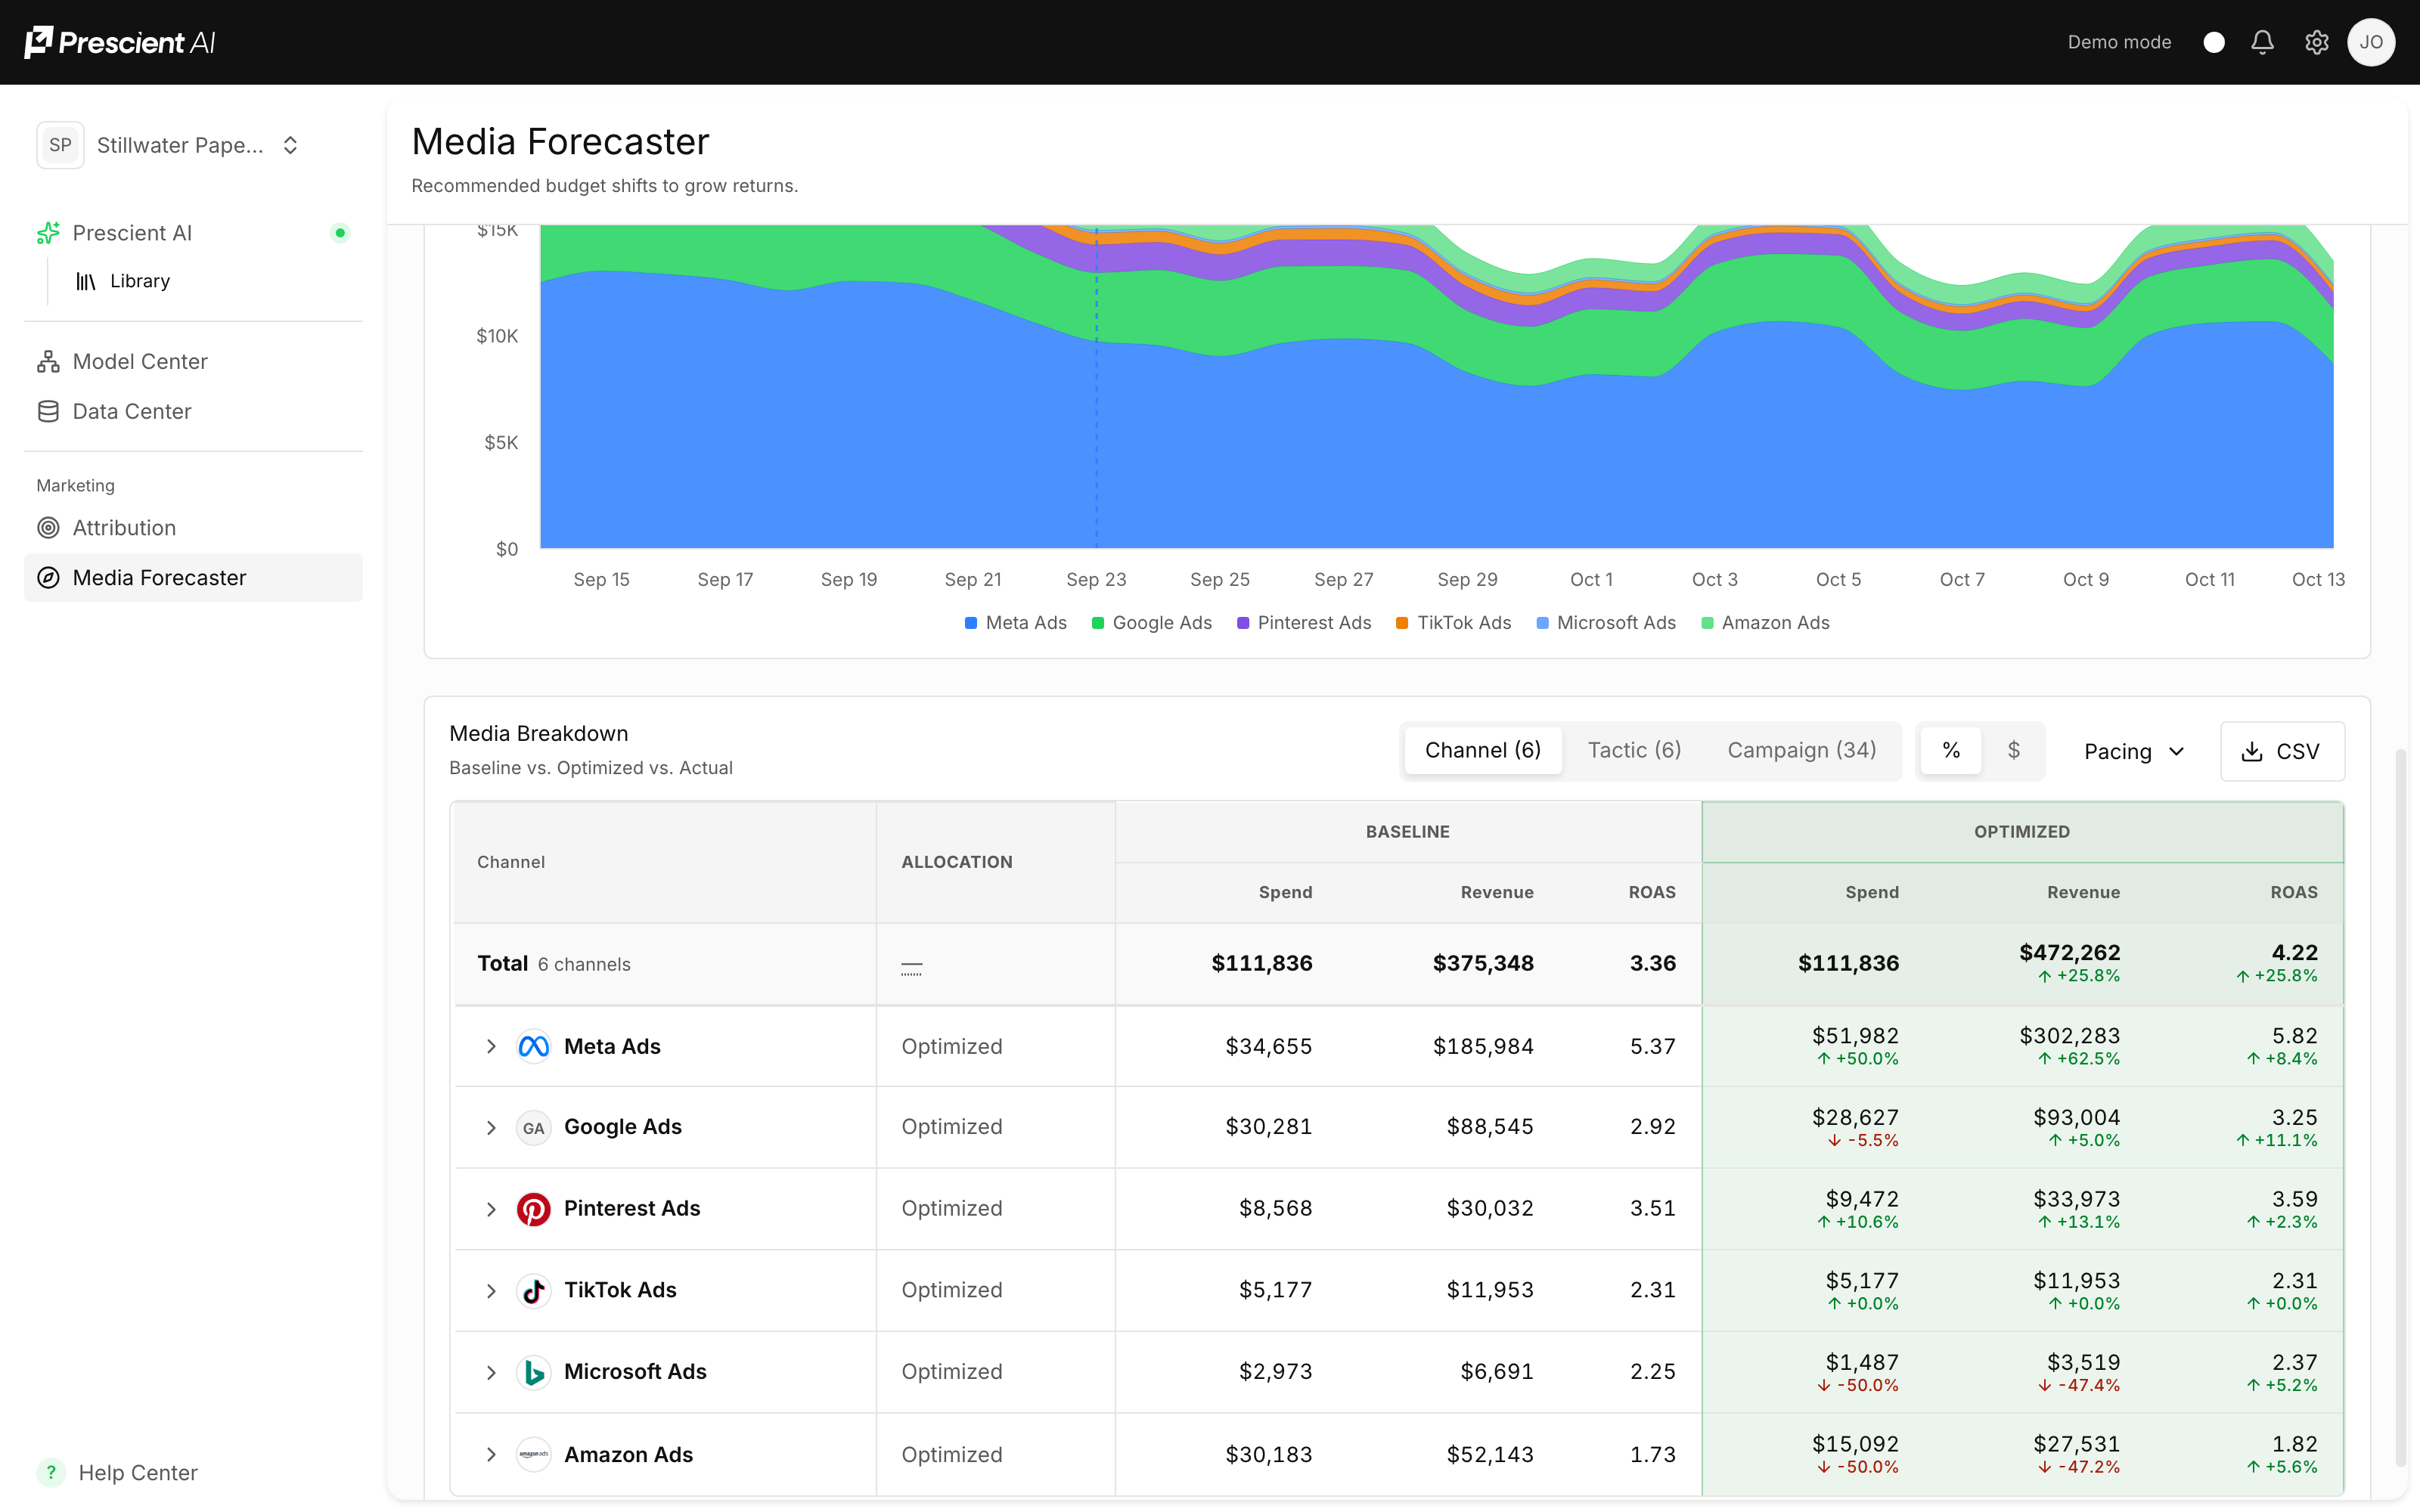
The breakdown follows the tab you are on — Channel, Tactic or Campaign — and so
does its export. Under CSV → Plan totals, download the breakdown and you get the
grain that is on screen, not a fixed level. The same menu also downloads the
plan schedule by channel, tactic or campaign.
The Plan Schedule
A plan does not spend evenly. Prescient's models are seasonally aware, so the
recommended spend for a Tuesday in early November is not the recommended spend for
a Tuesday in January — and an average per day would hide exactly the pattern you
need in order to execute the plan.
The plan schedule shows the spend and expected return for each period of the
plan, at the plan's own granularity: daily plans show days, weekly plans show weeks. Choose what each row counts with Rows by, and which figure to show with Metric — Media Revenue, Media Spend or Media ROAS. Each row compares Baseline, Optimized and Actual to date.
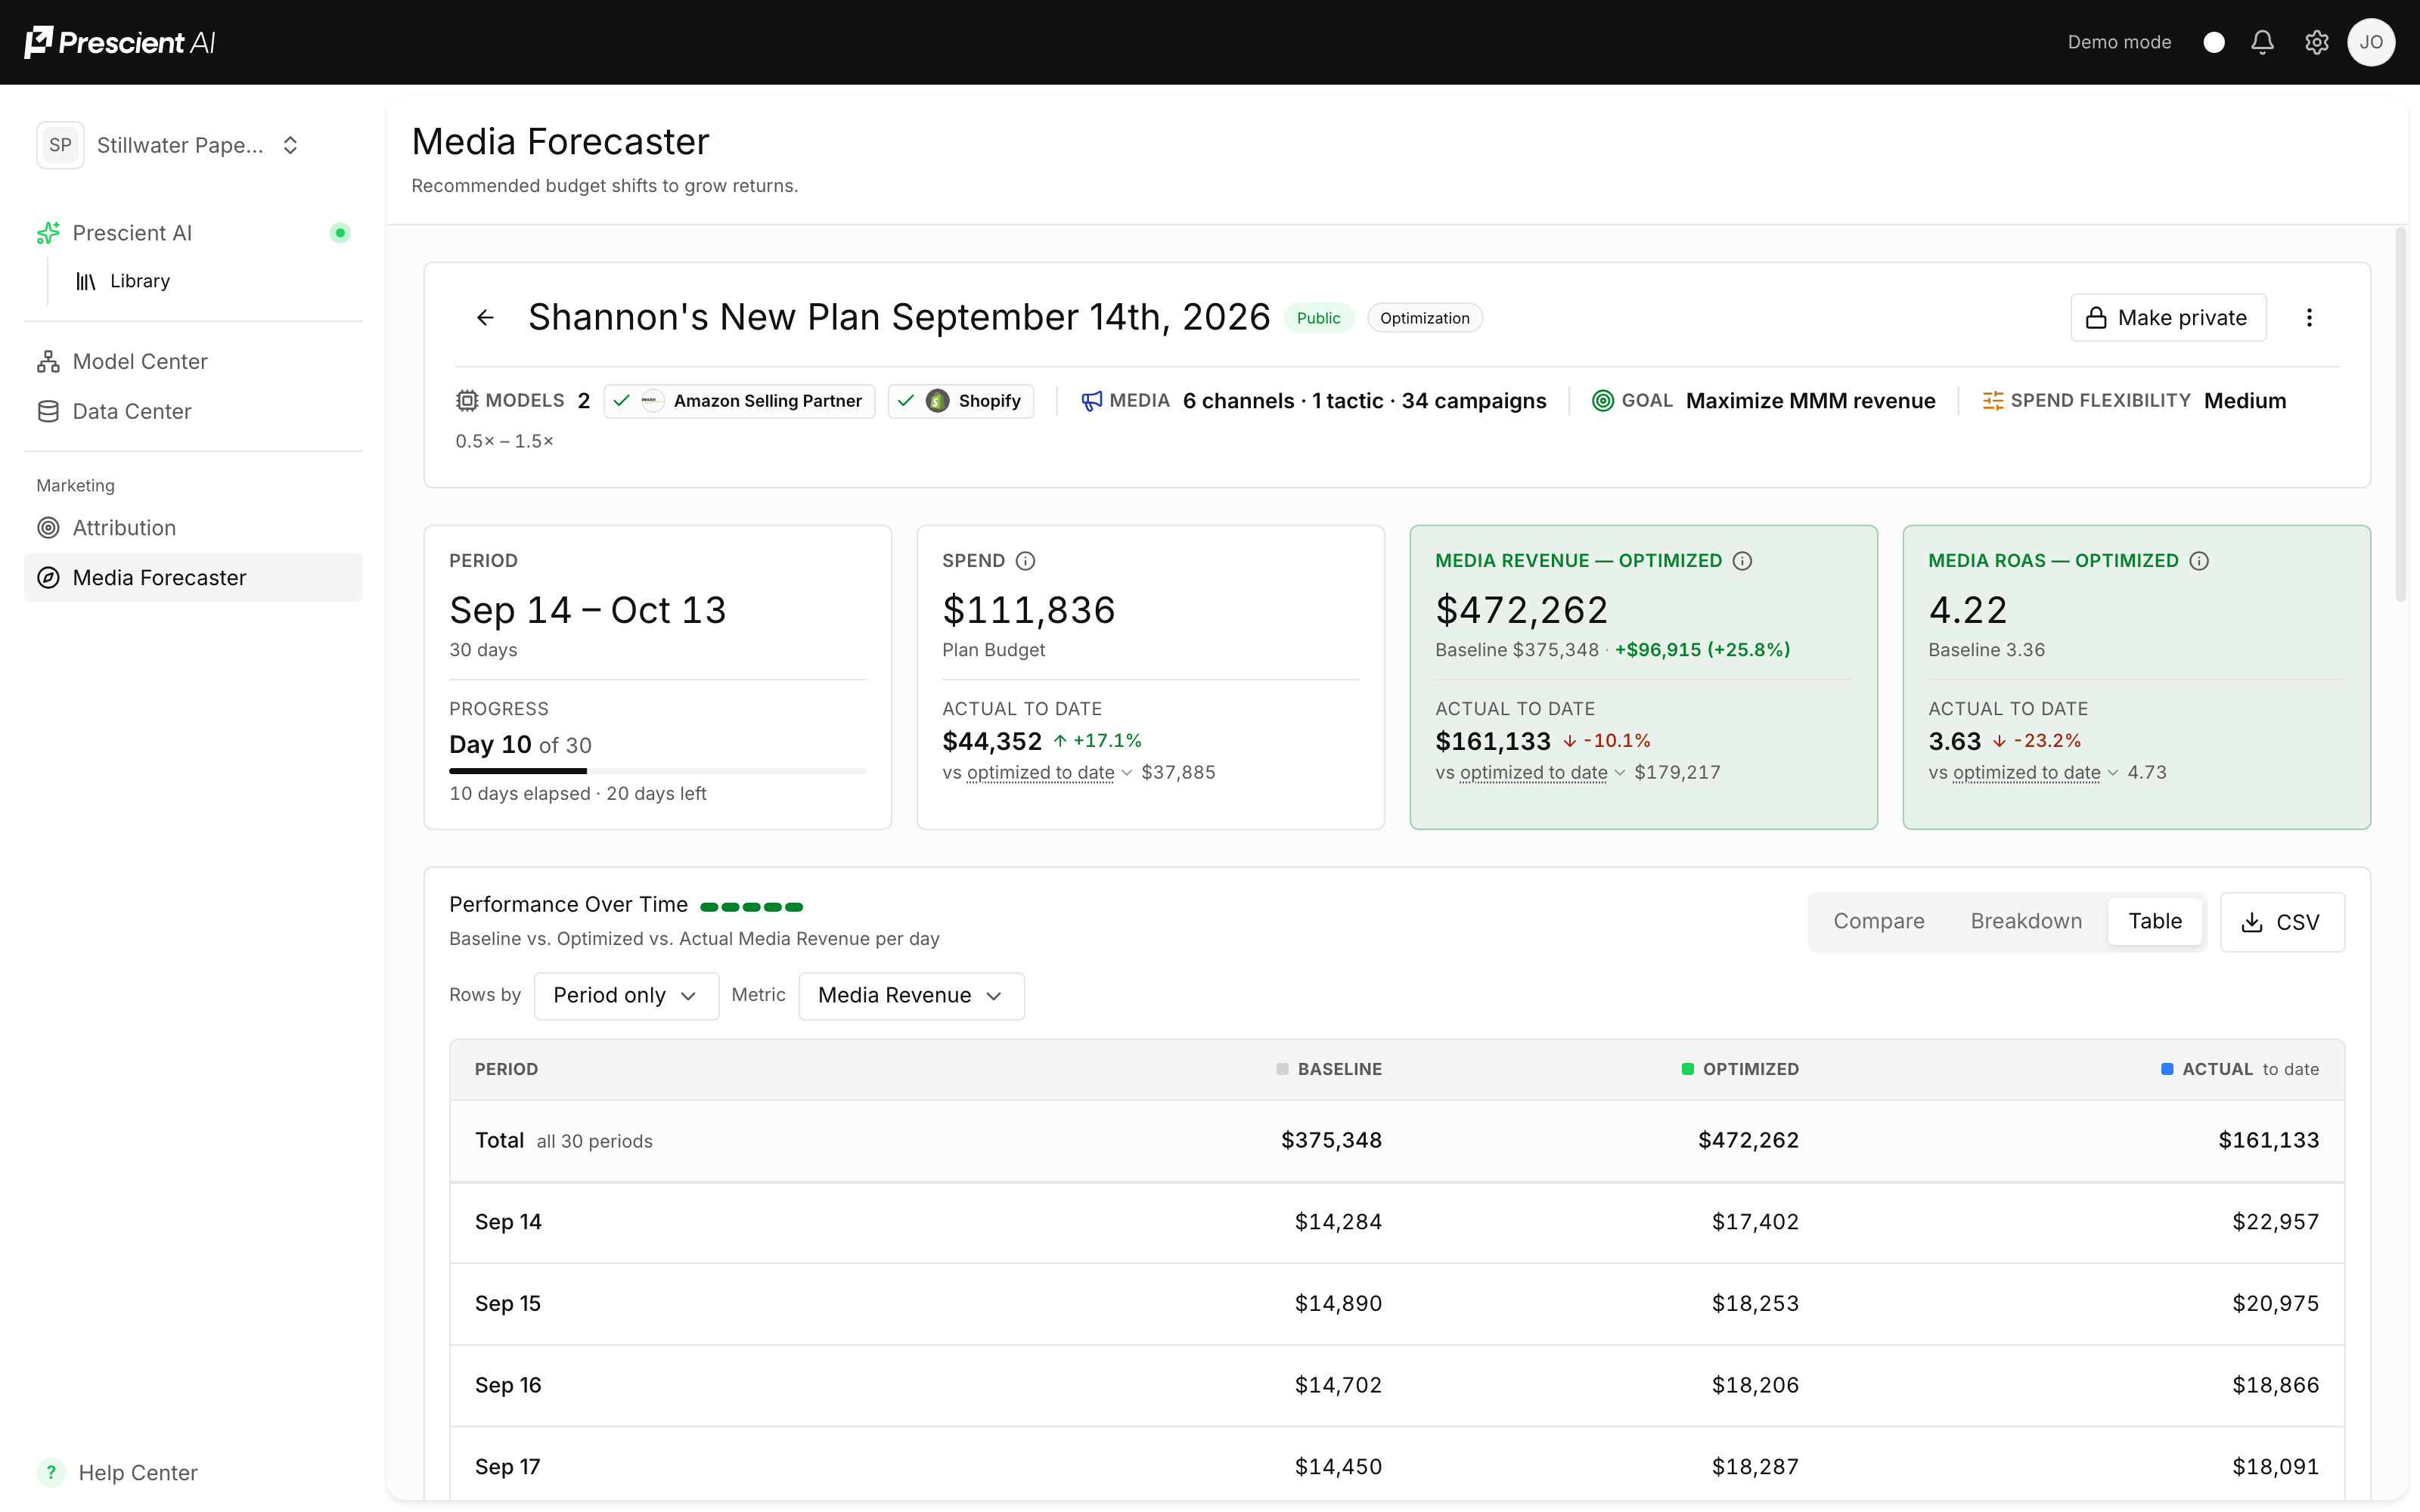
Choosing what to break it down by
| Rows by | Shows |
|---|---|
| Period only | One row per period for the whole plan |
| Channel | Each channel's spend and return, per period |
| Tactic | Each tactic's spend and return, per period |
| Model | Expected outcome per period, by outcome model |
Why the Model view shows no spend. A model does not own a share of your budget
— several models can describe the same spend. Splitting spend across models would
count the same dollars more than once, so the Model view reports outcomes only.
Reading the table
- The Total row is pinned at the top, and rows are ordered by their total, so the largest contributors come first.
- A blank cell means no recommendation for that period, which is not the same as a recommendation of zero.
- Under the Total row, Avg spend shows the average spend per period for each column — a starting budget for your ad platforms. Weekly plans show it per week; daily plans show it per day, and you can click per day to switch to per week. The periods below it still show how that spend should vary through the plan. Split by Channel or Tactic, each column's average adds up to the Period only figure. The Actual average covers only the days with reported spend, and the Model view has no Avg spend row, for the same reason it shows no spend.
- Long plans page 30 rows at a time.
Exporting the schedule
Download the schedule as a CSV to load into a spreadsheet, a media plan or a
flighting document. Use CSV on the Performance Over Time card, or CSV on the
Media Breakdown table, and choose one breakdown per file:
| Download | Contains |
|---|---|
| Plan total | One row per period for the whole plan (Performance Over Time only) |
| By channel | Each channel's spend and return, per period |
| By tactic | Each tactic's spend and return, per period |
| By campaign | Each campaign's spend and return, per period, with Channel, Tactic, Campaign and Campaign ID columns so you can filter or pivot. Optimization plans only |
| By model | Expected outcome per period, by outcome model (Performance Over Time only) |
Every file uses the plan's own granularity: a weekly plan exports weeks, not
estimated days. A cell with no reported actual yet, or no modeled value, is left
blank rather than zero.
Downloaded from the Media Breakdown, the schedule follows its channel filter: pick
two channels and the file holds just those two, with a Channels column naming
them so a forwarded file can't be mistaken for the whole plan.
Revenue and ROAS Trade-Offs
An optimized plan may increase revenue while lowering ROAS for a particular channel.
This does not necessarily mean the recommendation is inefficient.
As spend increases, media often experiences diminishing returns. A channel may still generate meaningful additional revenue even though each additional dollar produces a slightly lower return.
Prescient evaluates the complete plan rather than attempting to maximize every channel’s individual ROAS.
For example:
- Channel A may receive more spend and generate substantially more revenue at a slightly lower ROAS.
- Channel B may receive less spend because its next dollar is expected to produce less incremental revenue.
- Channel C may maintain a similar budget because its current allocation is already close to the modeled optimum.
Focus on the overall plan objective, not only the direction of one channel’s ROAS.
Expand a Channel
Select a channel row to open more detail.
The expanded view may show:
- Included tactics
- Per-model confidence
- Baseline and optimized performance
- Actual pacing
- Performance over time
- Revenue contribution by outcome model
This helps explain why Prescient recommended a particular allocation.
For example, a channel may have moderate performance in one storefront but strong expected impact across several retail and ecommerce models.
Multi-Model Forecasting
A key benefit of the Media Forecaster is the ability to optimize media across multiple business outcome models.
A channel may drive revenue through several destinations, including:
- Your ecommerce website
- Amazon
- TikTok Shop
- Retail partner websites
- Physical retail
- Other connected sales sources
Optimizing only one model could undervalue media that creates revenue elsewhere.
Prescient combines the selected models to evaluate the total expected effect of each allocation across the included business.
The confidence details show how well each model supports the channel-level recommendation.
Compare and Break Down Results
Use Compare to review the difference between baseline, optimized, and actual performance.
Use Breakdown to understand the composition of the total result.
These views answer different questions:
- Compare: Did the optimized plan improve the expected outcome?
- Breakdown: Which media, tactics, or models created that result?
Use both before making additional allocation changes.
Export Results
Select CSV to export the media breakdown for additional analysis or sharing.
The export can be useful for:
- Media buying teams
- Finance reviews
- Budget approvals
- Agency communication
- Forecast-versus-actual reporting
You can also switch between percentage and currency views where available.
Run it and watch it
Once a plan is live, how to tell whether it is going to plan.
My Plans
The main Media Forecaster page displays your existing plans.
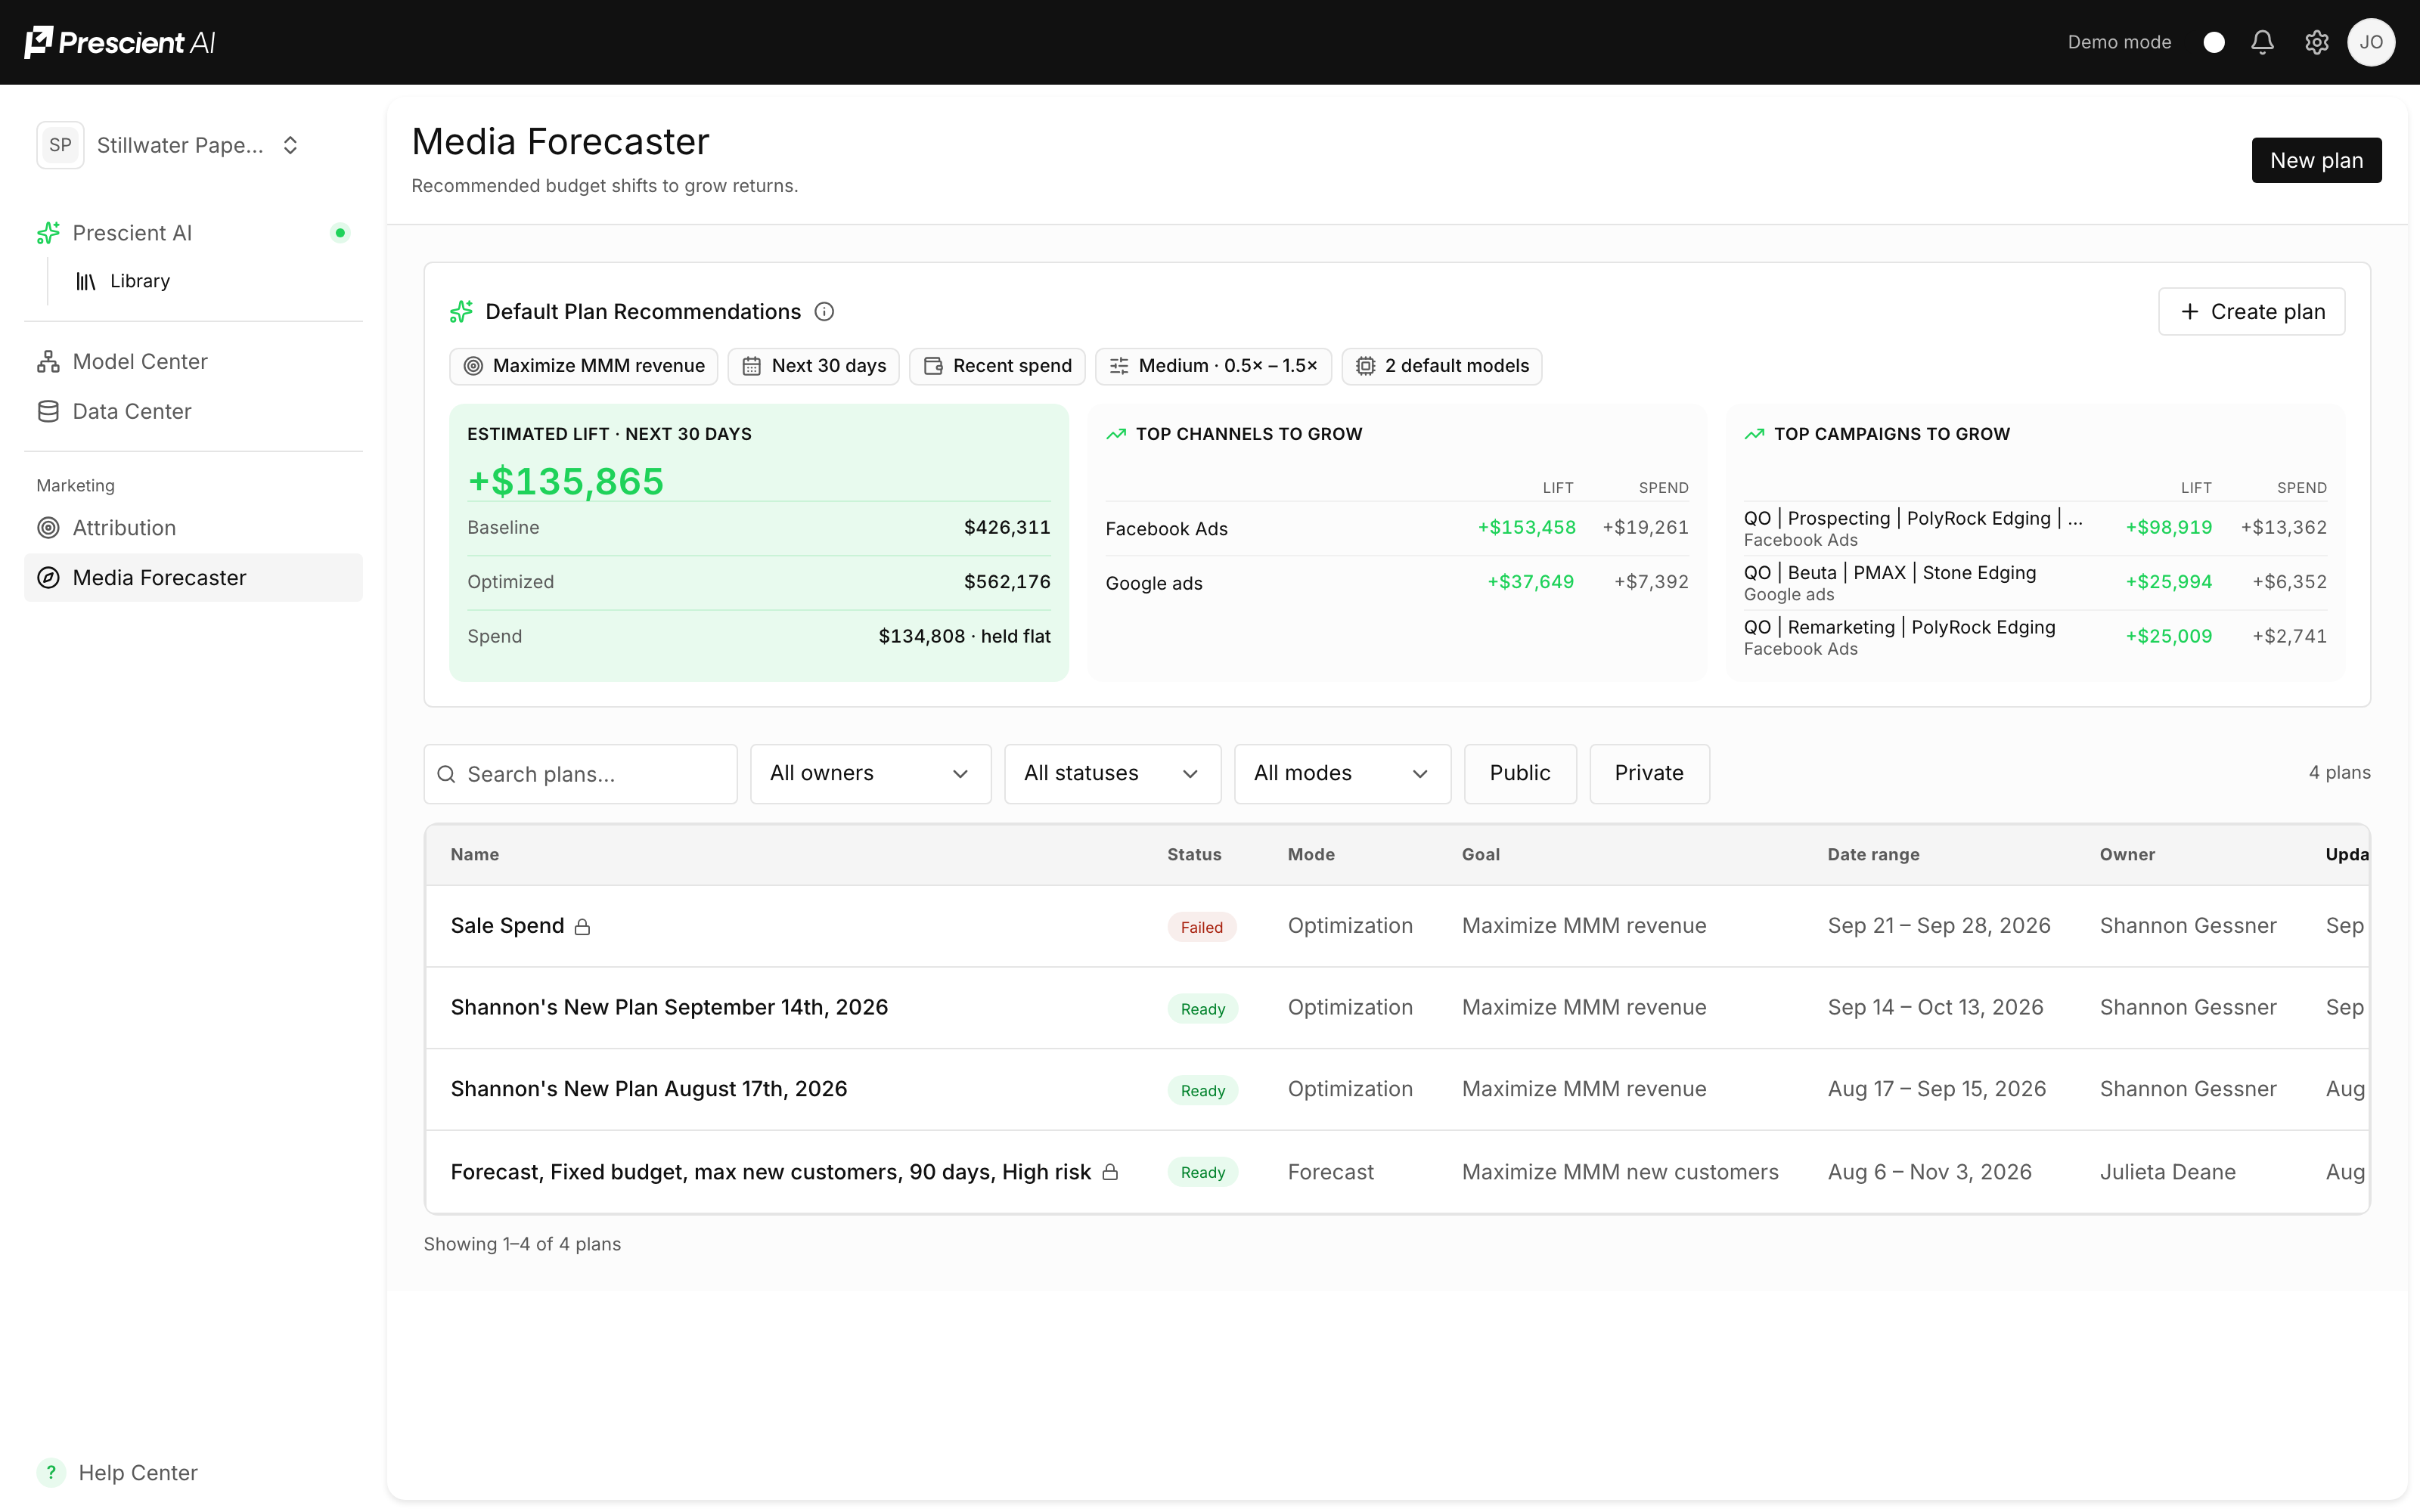
Each plan includes its name, owner, planning period, goal type, current status, the date it was last updated, and whether it is public or private. Use the search and filter controls to quickly find plans by owner, status, or visibility.
Plan Status
A plan can be in one of three statuses:
Ready – The forecast has been completed, and the plan is ready for review.
Processing – Prescient is generating the forecast and calculating the optimized budget allocation.
Failed – Prescient was unable to complete the forecast. Review the plan settings and try again, or contact your Prescient team for assistance.
Public and Private Plans
Plans can be created as:
- Private: Visible only to you
- Public: Available to other members of your Prescient organization
You can make a private plan public after reviewing the results.
Select New Plan to create a forecast.
How long a plan takes
| Plan type | What to expect |
|---|---|
| Forecast | Usually under a minute. |
| Typical Optimization | Usually 5–15 minutes, for roughly 10–50 campaigns. |
| Very large Optimization | 25–60 minutes for plans with several hundred campaigns. |
These are expectations from production testing, not guaranteed times. The timer starts when you submit, so it includes any time spent waiting for capacity — a plan submitted while a large batch is running will sit in the queue before it starts computing.
What makes a plan slower: Optimization rather than Forecast; more campaigns; more tactics; more outcome models; daily rather than weekly results; and a longer planning period. Fixed allocations and tighter Spend Flexibility reduce the search space, so they usually make a plan faster, not slower.
Forecast is quicker because it solves at tactic level — far fewer lines to balance than a campaign-level problem with per-campaign curves and guardrails.
If a plan is still running well past these ranges, it is worth reporting. Include the plan name, its mode, the planning period, and roughly how many campaigns it covers.
Monitor an Active Plan
After the planning period begins, return to the plan regularly to review implementation.
Focus on:
Spend Pacing
Is actual spend aligned with the amount expected at this point in the plan?
A forecast cannot be fairly evaluated when the recommended allocation has not been implemented.
Revenue Pacing
Is modeled media revenue tracking above or below the optimized expectation?
Review performance over a meaningful period rather than reacting to one day or week.
ROAS Pacing
Is actual modeled ROAS consistent with the expected trade-off between growth and efficiency?
Allocation
Are individual channels spending near their optimized levels?
Large differences between planned and actual allocations can explain why total results differ from the forecast.
Business Context
Consider events not reflected when the plan was created, such as:
- New promotions
- Inventory changes
- Creative launches
- Pricing updates
- Tracking interruptions
- Channel outages
- Changes in campaign strategy
Reference
Spend Flexibility
Spend Flexibility controls how far the optimizer may move each row from its Baseline — its reference-period share of the plan budget. It changes allocation flexibility, not your total plan budget.
| Preset | Range | What it means |
|---|---|---|
| Fixed | 1× | Keeps the current allocation mix, scaled to the plan budget. |
| Low | 0.8× – 1.2× | Keeps spend close to its current level. |
| Medium | 0.5× – 1.5× | Meaningful movement, with guardrails. The default. |
| High | 0× – 2× | Allows aggressive reductions and increases. |
| Unconstrained | 0× – 5× | Lets Prescient move spend wherever the model sees the best return, including cutting a row to zero. |
| Custom | any | Type your own multipliers. |
0.5× means half that row's baseline, whatever the budget. Because the limits scale with the budget, a budget much larger or smaller than usual fits without any special setting.
Above 2× (Unconstrained, or a Custom maximum over 2×), a row can more than double. Those results rely on extrapolated curve behavior, so the form shows a caution; treat big moves as a starting point for review.
It does not: add campaigns that are not already in the plan; remove saturation or diminishing returns; make an unrealistic campaign mix realistic; choose your total budget; or guarantee a revenue, ROAS or CAC result.
Row-level Fixed, Min spend and Max spend amounts are respected first; the remaining rows share what is left within their flexibility band.
Adaptive Bounds has been retiredIt existed to widen the limits when a budget was far from reference-period spend. Every preset now scales with the budget you enter, which is what Adaptive Bounds used to do — so there is nothing to switch on. If you want Prescient to allocate as freely as possible, choose Unconstrained. Plans created before the change still show "Adaptive" with the range they actually ran with; they are unaffected, and re-running one lets you pick a preset above.
Target and required-spend plans work differently. When a plan finds the spend needed to reach a goal, the budget is only a ceiling, so flexibility is measured from each row's reference spend rather than from a share of the budget.
If the real problem is that the period will have a different campaign roster, that is a reason to use Forecast — not a reason to widen the bounds.
Best Practices
Use a clear objective
Name the plan based on the decision you are making and choose the appropriate goal.
Include all relevant outcome models
Include the ecommerce, marketplace, and retailer models affected by the media being planned.
Review confidence
Use larger changes where the models provide stronger evidence. Consider smaller tests when confidence is limited.
Add business constraints
Do not allow Prescient to freely adjust spend that cannot realistically be changed.
Compare against a meaningful baseline
Make sure the baseline reflects the current media strategy you want to improve.
Evaluate the complete plan
A decrease in one channel’s ROAS may support a larger increase in total revenue.
Review implementation pacing
A forecast should be evaluated against what was actually spent, not only what was planned.
Save multiple scenarios
Create separate plans to compare:
- Different total budgets
- Different planning periods
- Different included media
- Different business constraints
- Different sets of revenue models
Keep plans private while drafting
Make the plan public when it is ready for broader review.
Frequently Asked Questions
Does Prescient automatically change my media budgets?
No. The Media Forecaster creates a recommended plan. Your team controls implementation in the relevant advertising platforms.
Why did Prescient reduce a high-ROAS channel?
The channel may have strong average historical ROAS but weaker expected returns on its next dollar of spend. Prescient optimizes marginal future performance, not only historical averages.
Why did optimized ROAS fall while revenue increased?
The plan may be investing more to generate additional total revenue. Scaling often lowers efficiency because of diminishing returns.
Why are actual results much lower than the forecast?
Check:
- How much of the planning period has elapsed
- Whether spend is pacing to plan
- Whether the optimized allocation was implemented
- Whether current data has finished syncing
- Whether major business conditions changed
Why is a channel missing?
It may not have been selected, may have had no recent spend, or may not contain enough measurable information for the plan.
Can I include several storefronts or retailers?
Yes. Select the relevant models when creating the plan so Prescient can evaluate media impact across those outcomes.
What does per-model confidence mean?
It shows how strongly each selected outcome model supports the forecast for that channel.
Can I edit a finished plan?
Depending on the plan state, you may need to create a new scenario to change its budget, dates, included media, or objective. Keeping separate scenarios also makes comparisons easier.
Key Takeaways
Media Forecaster turns Prescient’s MMM results into forward-looking media plans.
Plans optimize a defined budget across selected media.
Multiple revenue models can be evaluated together.
Baseline shows expected performance before optimization.
Optimized shows Prescient’s recommended allocation and forecast.
Actual to Date tracks implementation and observed performance.
Confidence indicates the strength of evidence supporting each recommendation.
Media Breakdown explains changes at the channel and tactic levels.
The best plan should be evaluated against its total objective, not only individual channel ROAS.
Prescient recommends the allocation; your team remains in control of implementation.
Can I edit a plan after it has run?
No — a plan with a result is fixed. Use Duplicate Plan to create an editable copy with the same settings. A plan that failed can be edited directly.
How do I stop the optimizer putting more money into a channel than I can spend?
Set a Max spend on that row.
Why doesn't the schedule just divide my budget by the number of days?
Because that would discard the seasonality the model exists to capture. Each period carries its own recommendation.
Why is a cell in the schedule blank rather than zero?
Blank means there is no recommendation for that period. A zero would mean the model recommends spending nothing, which is a different statement.
Updated 7 days ago