
Model Center
The Model Center provides an overview of your Marketing Mix Models, allowing you to monitor model health, compare modeled and observed performance, and review the latest modeling results across your business outcomes.
Understand and validate your models
The Model Center gives you a clear view of the models powering Prescient’s attribution and media forecasts.
Use it to:
- Monitor model accuracy
- Compare modeled and observed performance
- Review different model configurations
- Understand the assumptions behind each model
- Confirm which configuration is active
How this fits together
%%{init: {"theme":"base","flowchart":{"curve":"basis","nodeSpacing":50,"rankSpacing":68,"padding":12},"themeVariables":{"fontSize":"14px","primaryColor":"#ffffff","primaryTextColor":"#111111","primaryBorderColor":"#d4d4d4","lineColor":"#8a8a8a","textColor":"#111111","edgeLabelBackground":"#ffffff","clusterBkg":"#fafafa","clusterBorder":"#ebebeb"}}}%%
flowchart LR
  DC("<b>Data Center</b><br/>connectors · channels · tactics") --> MC("<b>Model Center</b><br/>are the models trustworthy?")
  MC --> ATT("<b>Attribution</b><br/>what your media did")
  MC --> MF("<b>Media Forecaster</b><br/>what to do next")
  AI("<b>Prescient AI</b><br/>ask across all of it") -.-> ATT
  AI -.-> MF
  MF --> EX("<b>You execute</b><br/>in your ad platforms")
  EX --> DC
  classDef here fill:#111111,stroke:#111111,stroke-width:1.5px,color:#ffffff
  classDef accent fill:#f1fcf5,stroke:#1fd25a,stroke-width:1.5px,color:#111111
  classDef choice fill:#fafafa,stroke:#c9c9c9,stroke-width:1.5px,color:#5a5a5a
  class MC here
  linkStyle default stroke:#8a8a8a,stroke-width:2px
Can I trust this number?
%%{init: {"theme":"base","flowchart":{"curve":"basis","nodeSpacing":50,"rankSpacing":68,"padding":12},"themeVariables":{"fontSize":"14px","primaryColor":"#ffffff","primaryTextColor":"#111111","primaryBorderColor":"#d4d4d4","lineColor":"#8a8a8a","textColor":"#111111","edgeLabelBackground":"#ffffff","clusterBkg":"#fafafa","clusterBorder":"#ebebeb"}}}%%
flowchart TD
  D("<b>Your connected data</b>") --> T("<b>The model trains</b>")
  T --> CF("<b>Current Fit</b><br/>does it explain the period<br/>you are looking at?")
  T --> BT("<b>Backtest</b><br/>can it predict data<br/>it never saw?")
  CF --> C{"<b>Confident enough</b><br/>to act?"}
  BT --> C
  C -->|"yes"| A("<b>Use Attribution and</b><br/>the Media Forecaster")
  C -->|"not yet"| I("<b>Check the Data Center</b><br/>for gaps or lag")
  classDef here fill:#111111,stroke:#111111,stroke-width:1.5px,color:#ffffff
  classDef accent fill:#f1fcf5,stroke:#1fd25a,stroke-width:1.5px,color:#111111
  classDef choice fill:#fafafa,stroke:#c9c9c9,stroke-width:1.5px,color:#5a5a5a
  class A accent
  class C choice
  linkStyle default stroke:#8a8a8a,stroke-width:2px
Find your way around
Judge the models
Overview · Model accuracy · Current Fit and Backtest
Go deeper on one model
Model health · Attribution
Model Center Overview
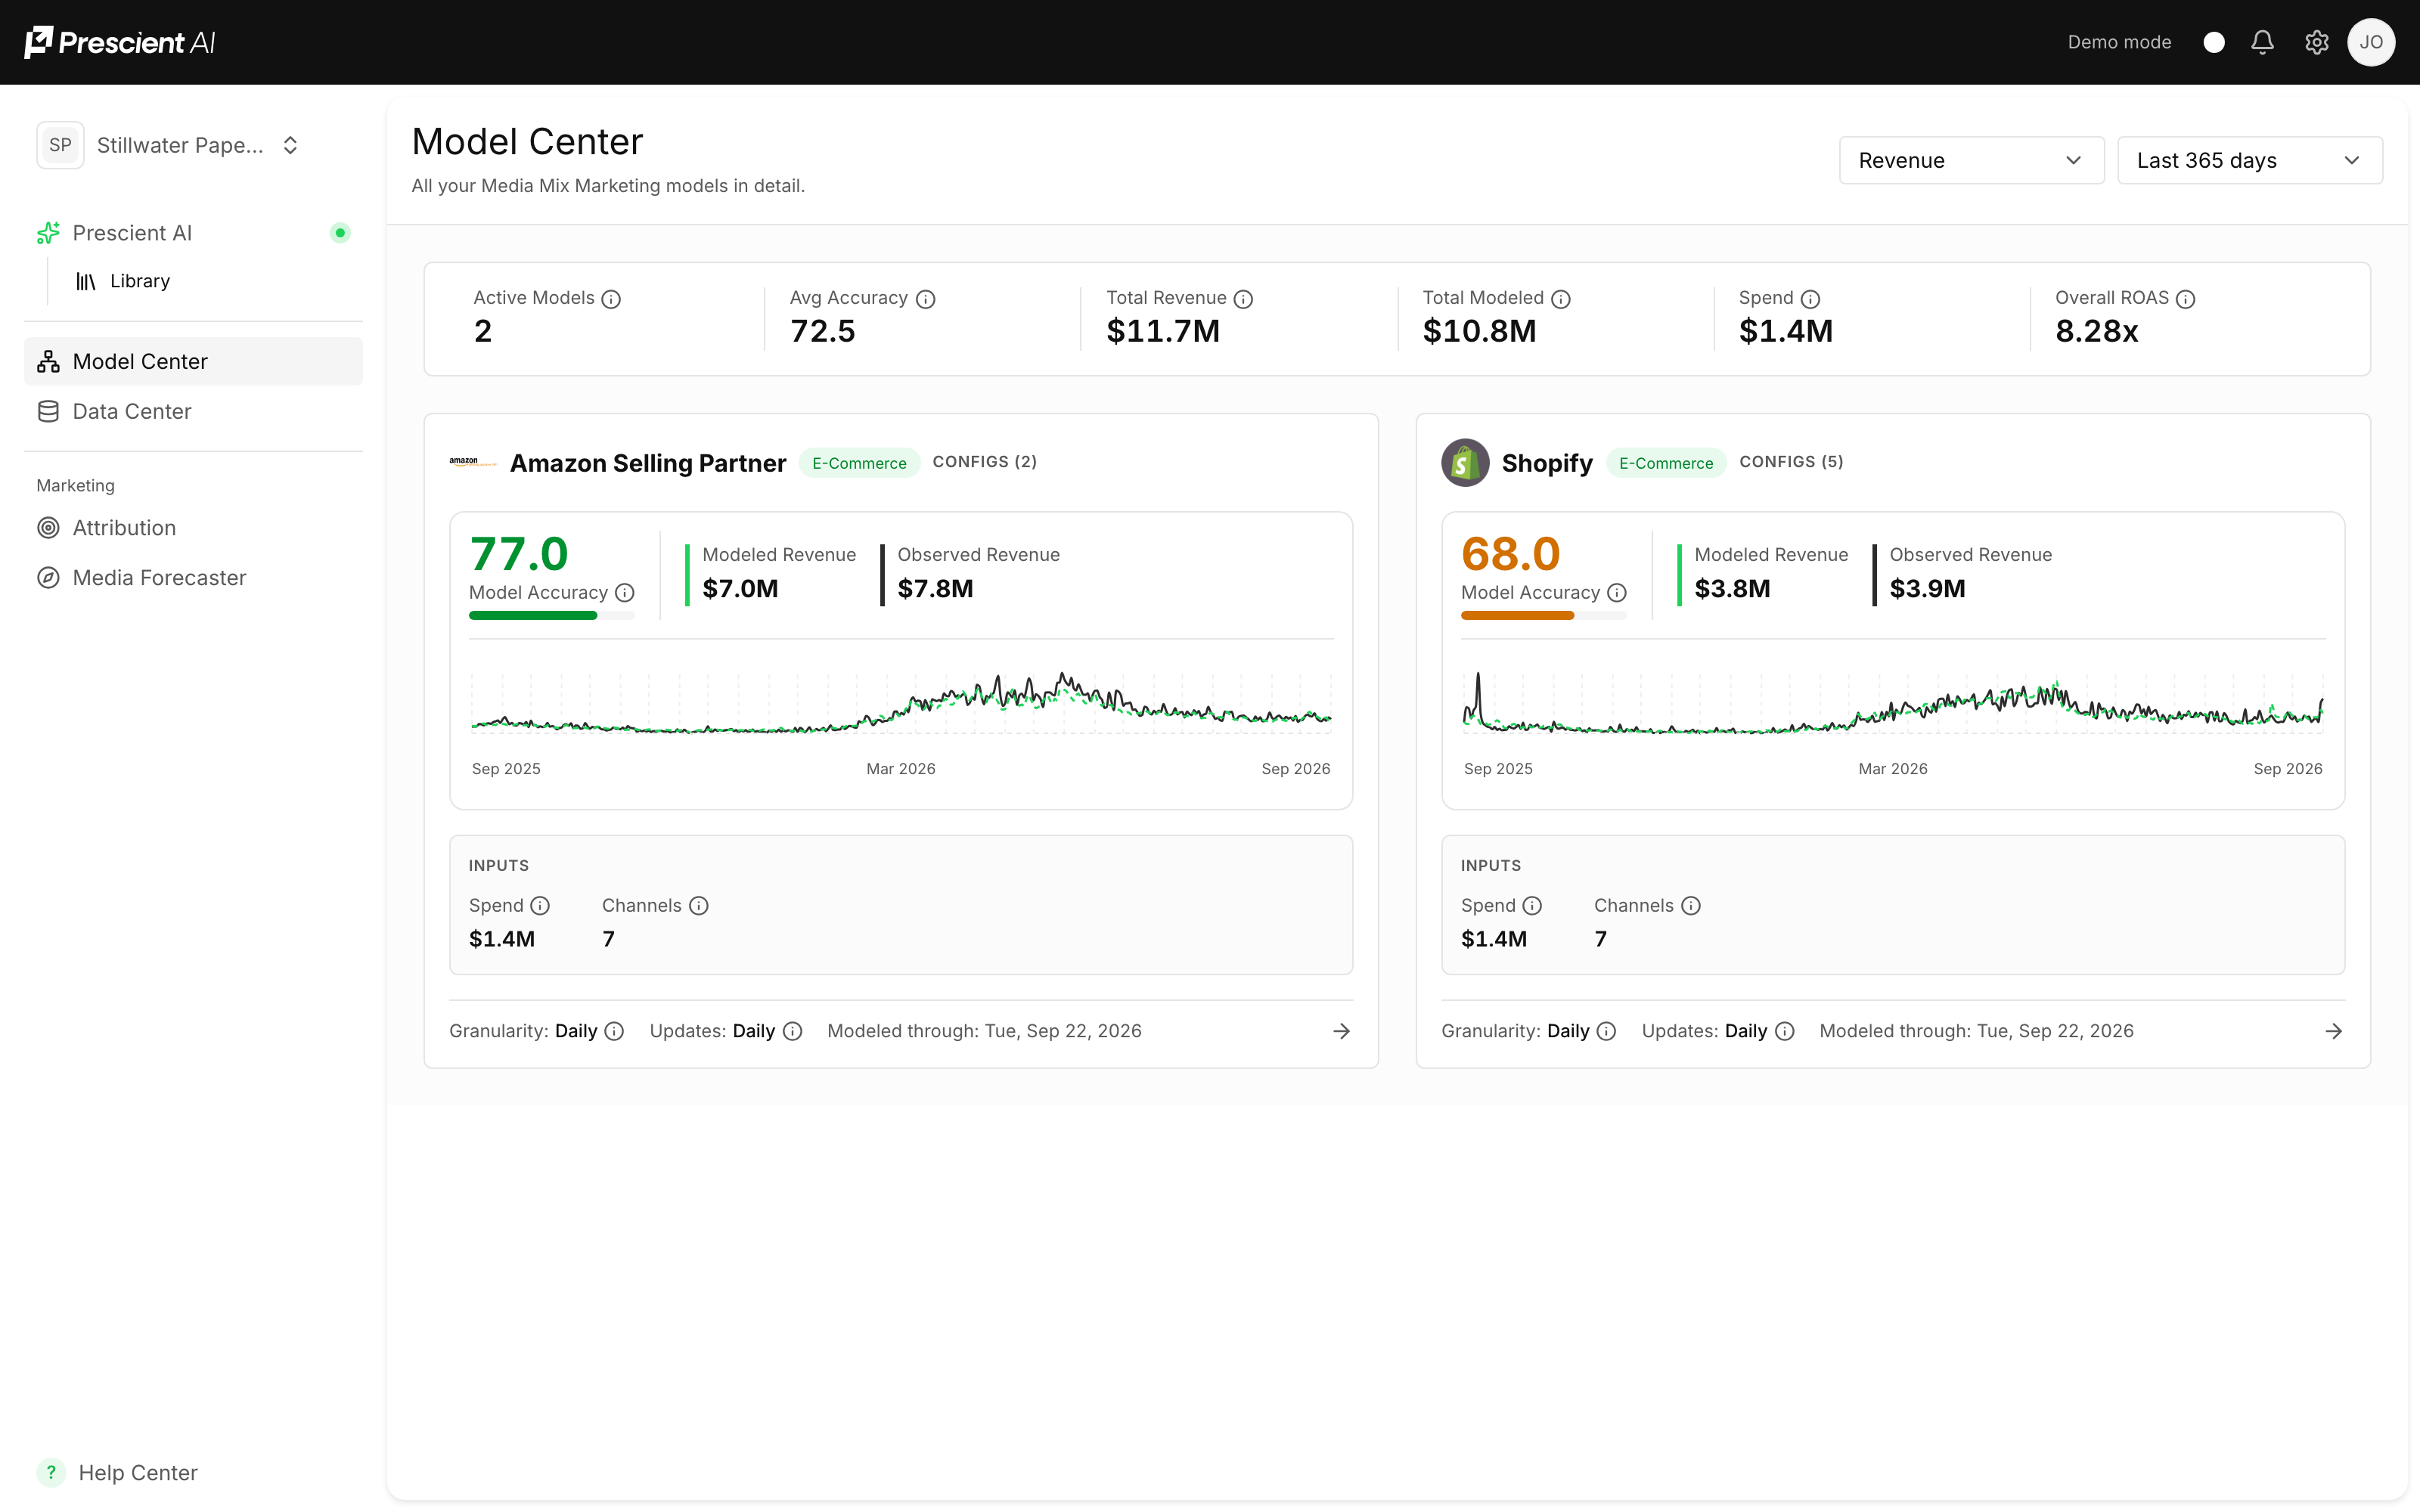
The main page summarizes your modeling environment, including:
- Active models
- Active configurations
- Average model accuracy
- Total observed and modeled results
- Media spend
- Overall modeled ROAS
Model Cards
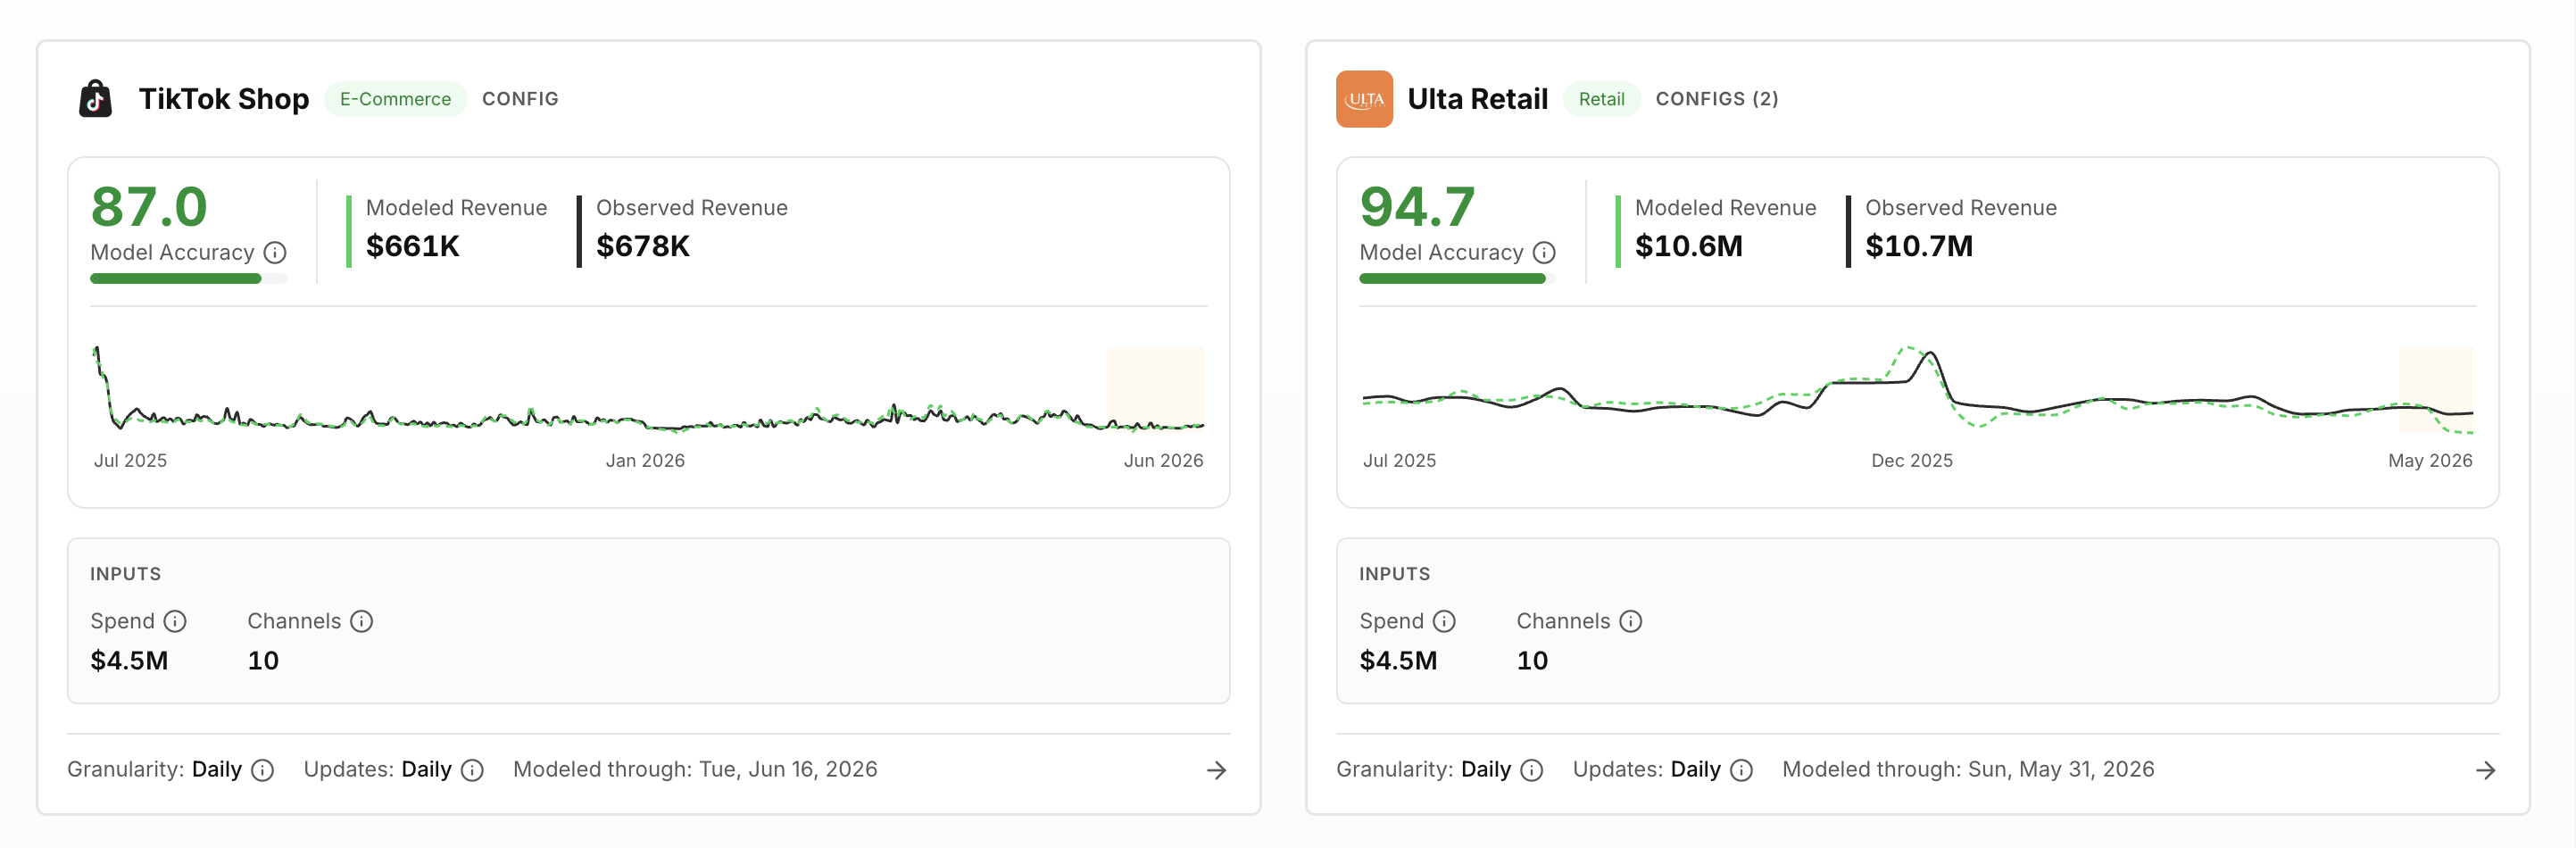
Each card represents a business outcome source, such as an ecommerce store, retailer, or marketplace.
The card shows:
- Model accuracy: An estimate of how accurately this model forecasts future performance, learned from your historical data. (See detailed explanation below)
- Modeled performance: Outcome estimated by the Marketing Mix Model
- Observed performance: Actual recorded outcome
- Historical fit: Comparison of modeled and observed performance over time
- Inputs: Total media spend and number of channels included in the model.
- Model Details: Data granularity, update frequency, and the date of the latest model run.
Use the filters at the top of the page to change the modeled outcome and reporting period.
Model Accuracy
Model accuracy indicates how closely Prescient’s modeled results align with observed business performance.
A higher score means the model has more closely represented historical results over the selected period.
Accuracy should be considered alongside:
- Forecast performance on data that was not used for training
- Data quality and completeness
- Model stability
- Business context
- The reasonableness of attribution results
A high accuracy score alone does not guarantee that every individual channel result is correct. Prescient AI evaluates multiple signals when selecting the model configuration used for attribution and forecasting.
Current Fit and Backtest
Prescient reports model accuracy two different ways, and they answer two different
questions. Reading one as the other is the most common source of confusion on this
page.
| What it measures | Moves with the date range? | |
|---|---|---|
| Current Fit | How well the model explains the period you are looking at | Yes |
| Backtest | Accuracy over the most recent period the model did not train on | No |
Current Fit answers "does the model explain what happened here?" It follows the
date range you have selected, so it changes as you move around the data.
Backtest answers "can this model predict data it has never seen?" It is measured
over the most recent stretch of history held out of training — roughly the last 30
days — and it stays fixed regardless of the date range above it, because it is a
property of the model, not of your current view.
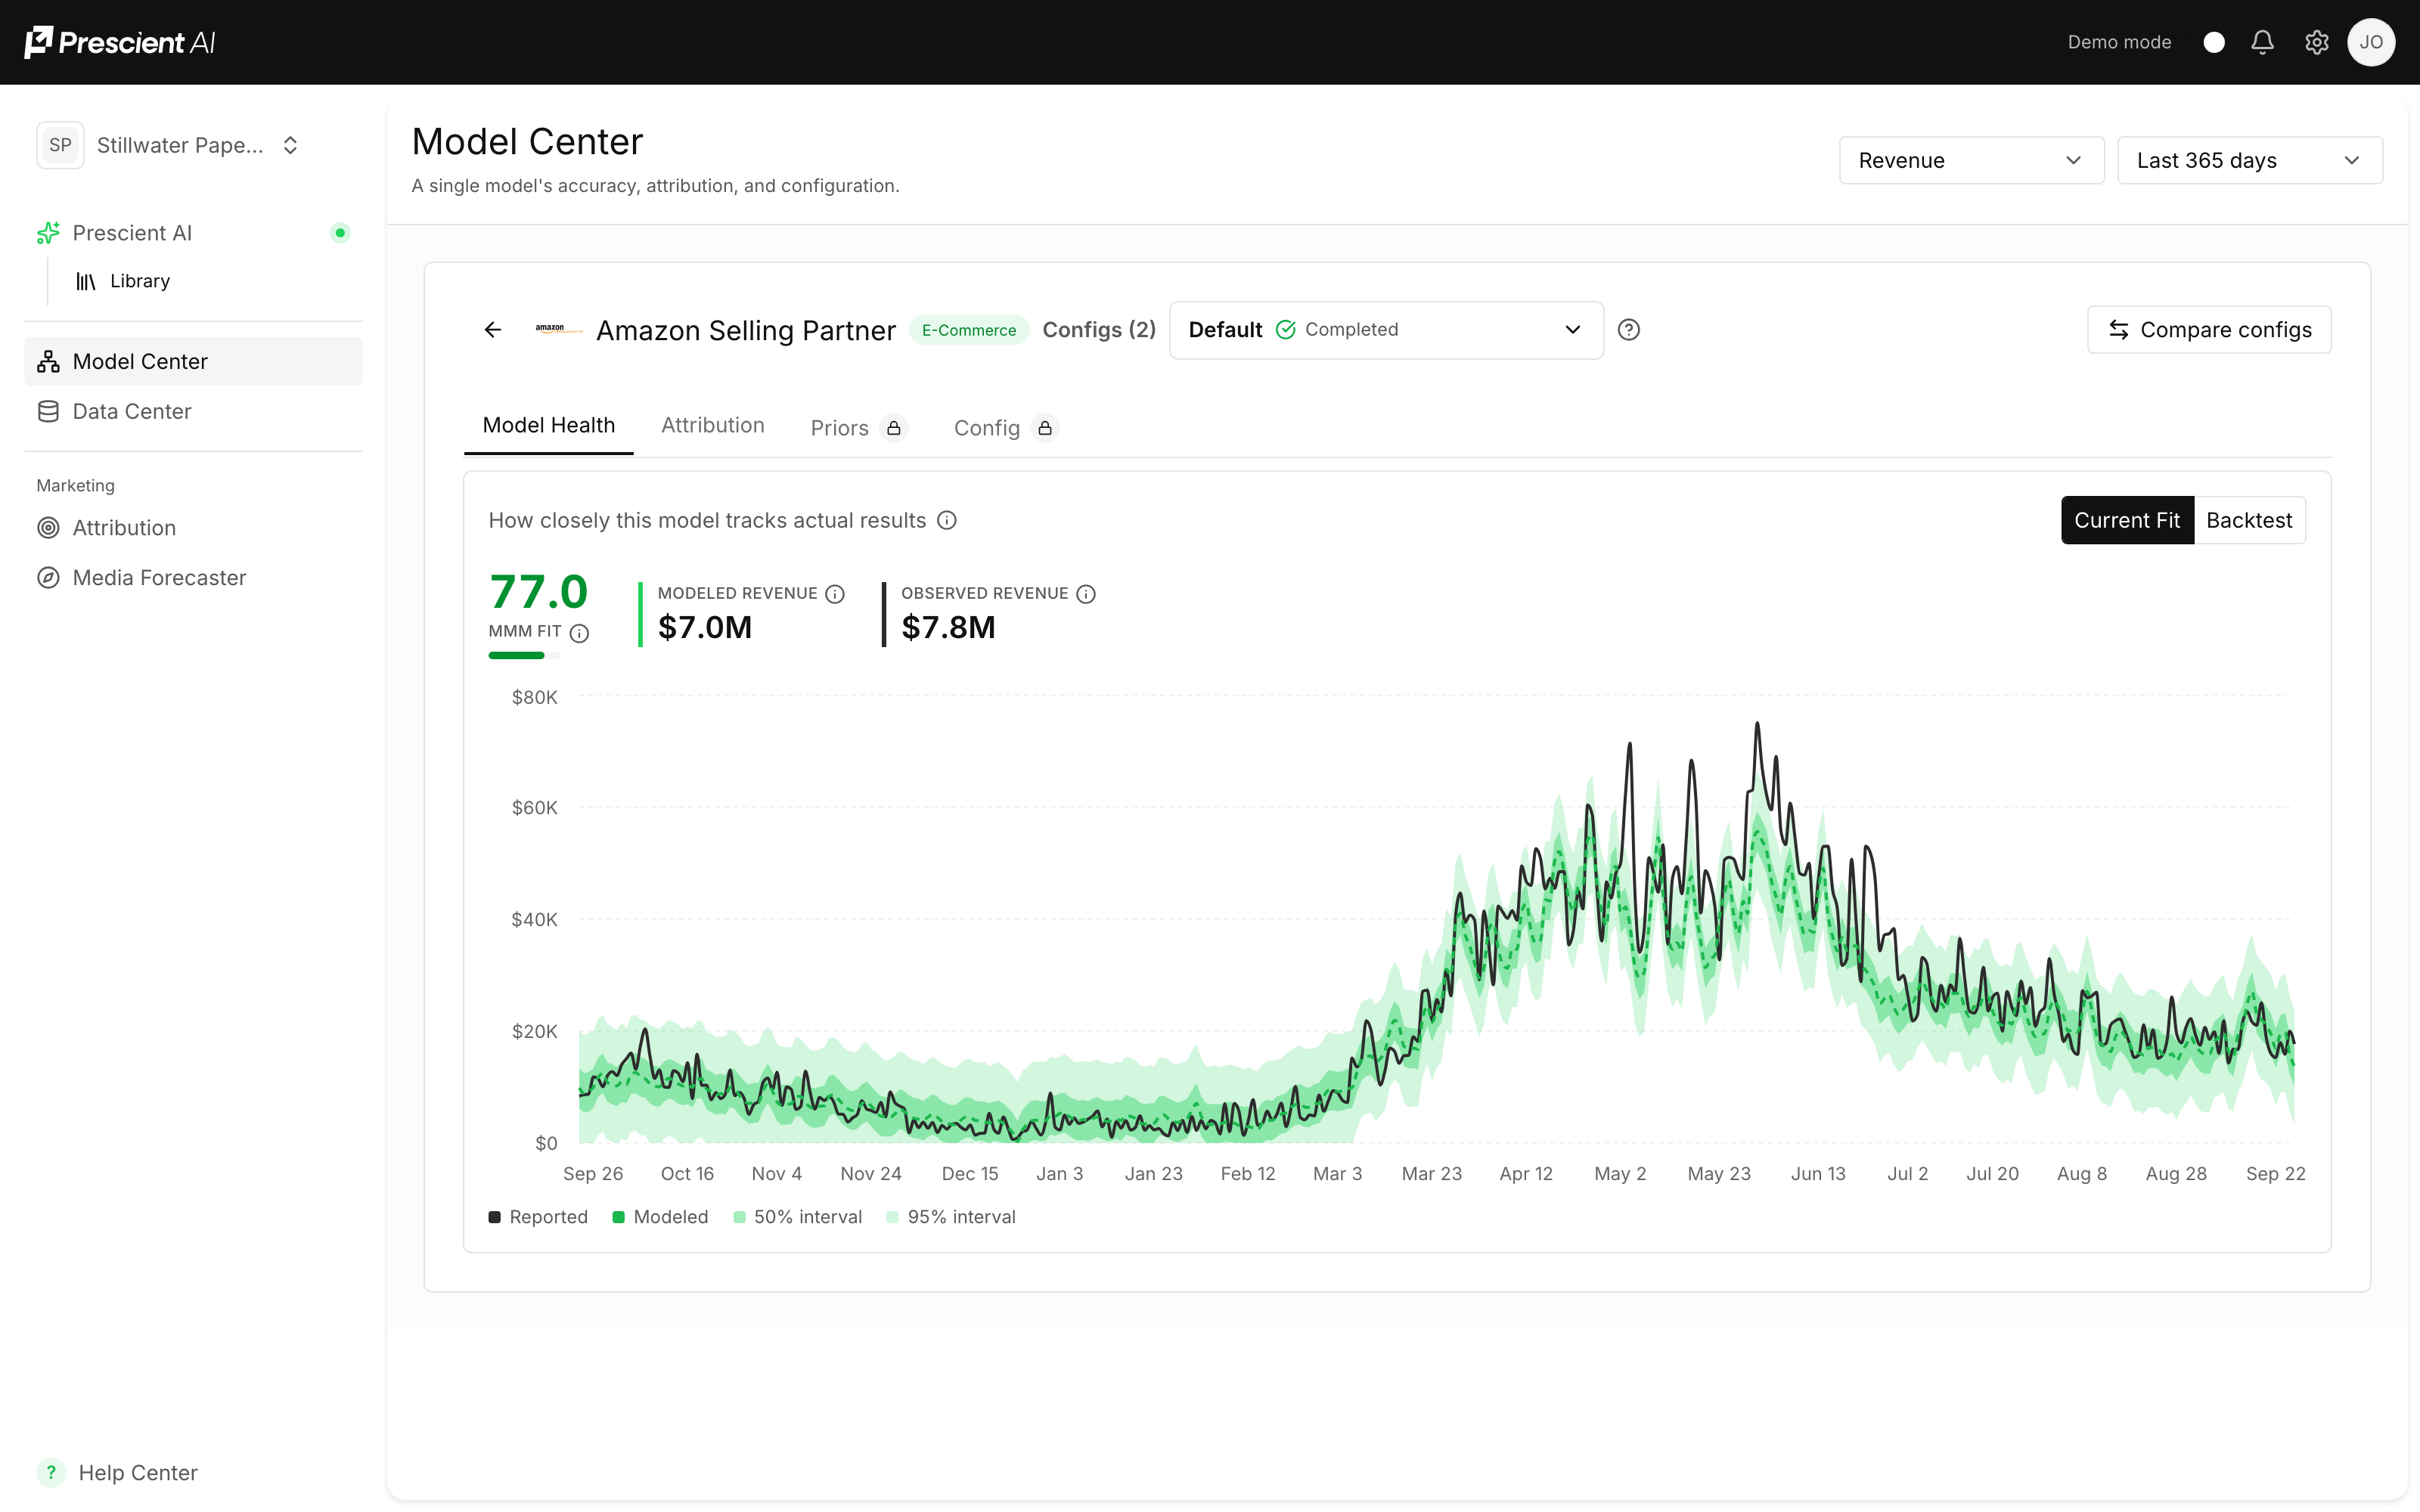
Why the backtest chart appears to end before today. It does. The backtest window
is held-out history, so it ends where the model's training data ends. That is the
measurement working as intended, not stale data.
Select a model card to review its details
Each model contains several possible configurations. The configuration marked Active is currently used across Prescient’s attribution and forecasting features.
Use the configuration menu to explore another version or select Compare configs to review configurations side by side.
1. Model Health
The Model Health tab shows how well the model represents historical performance.
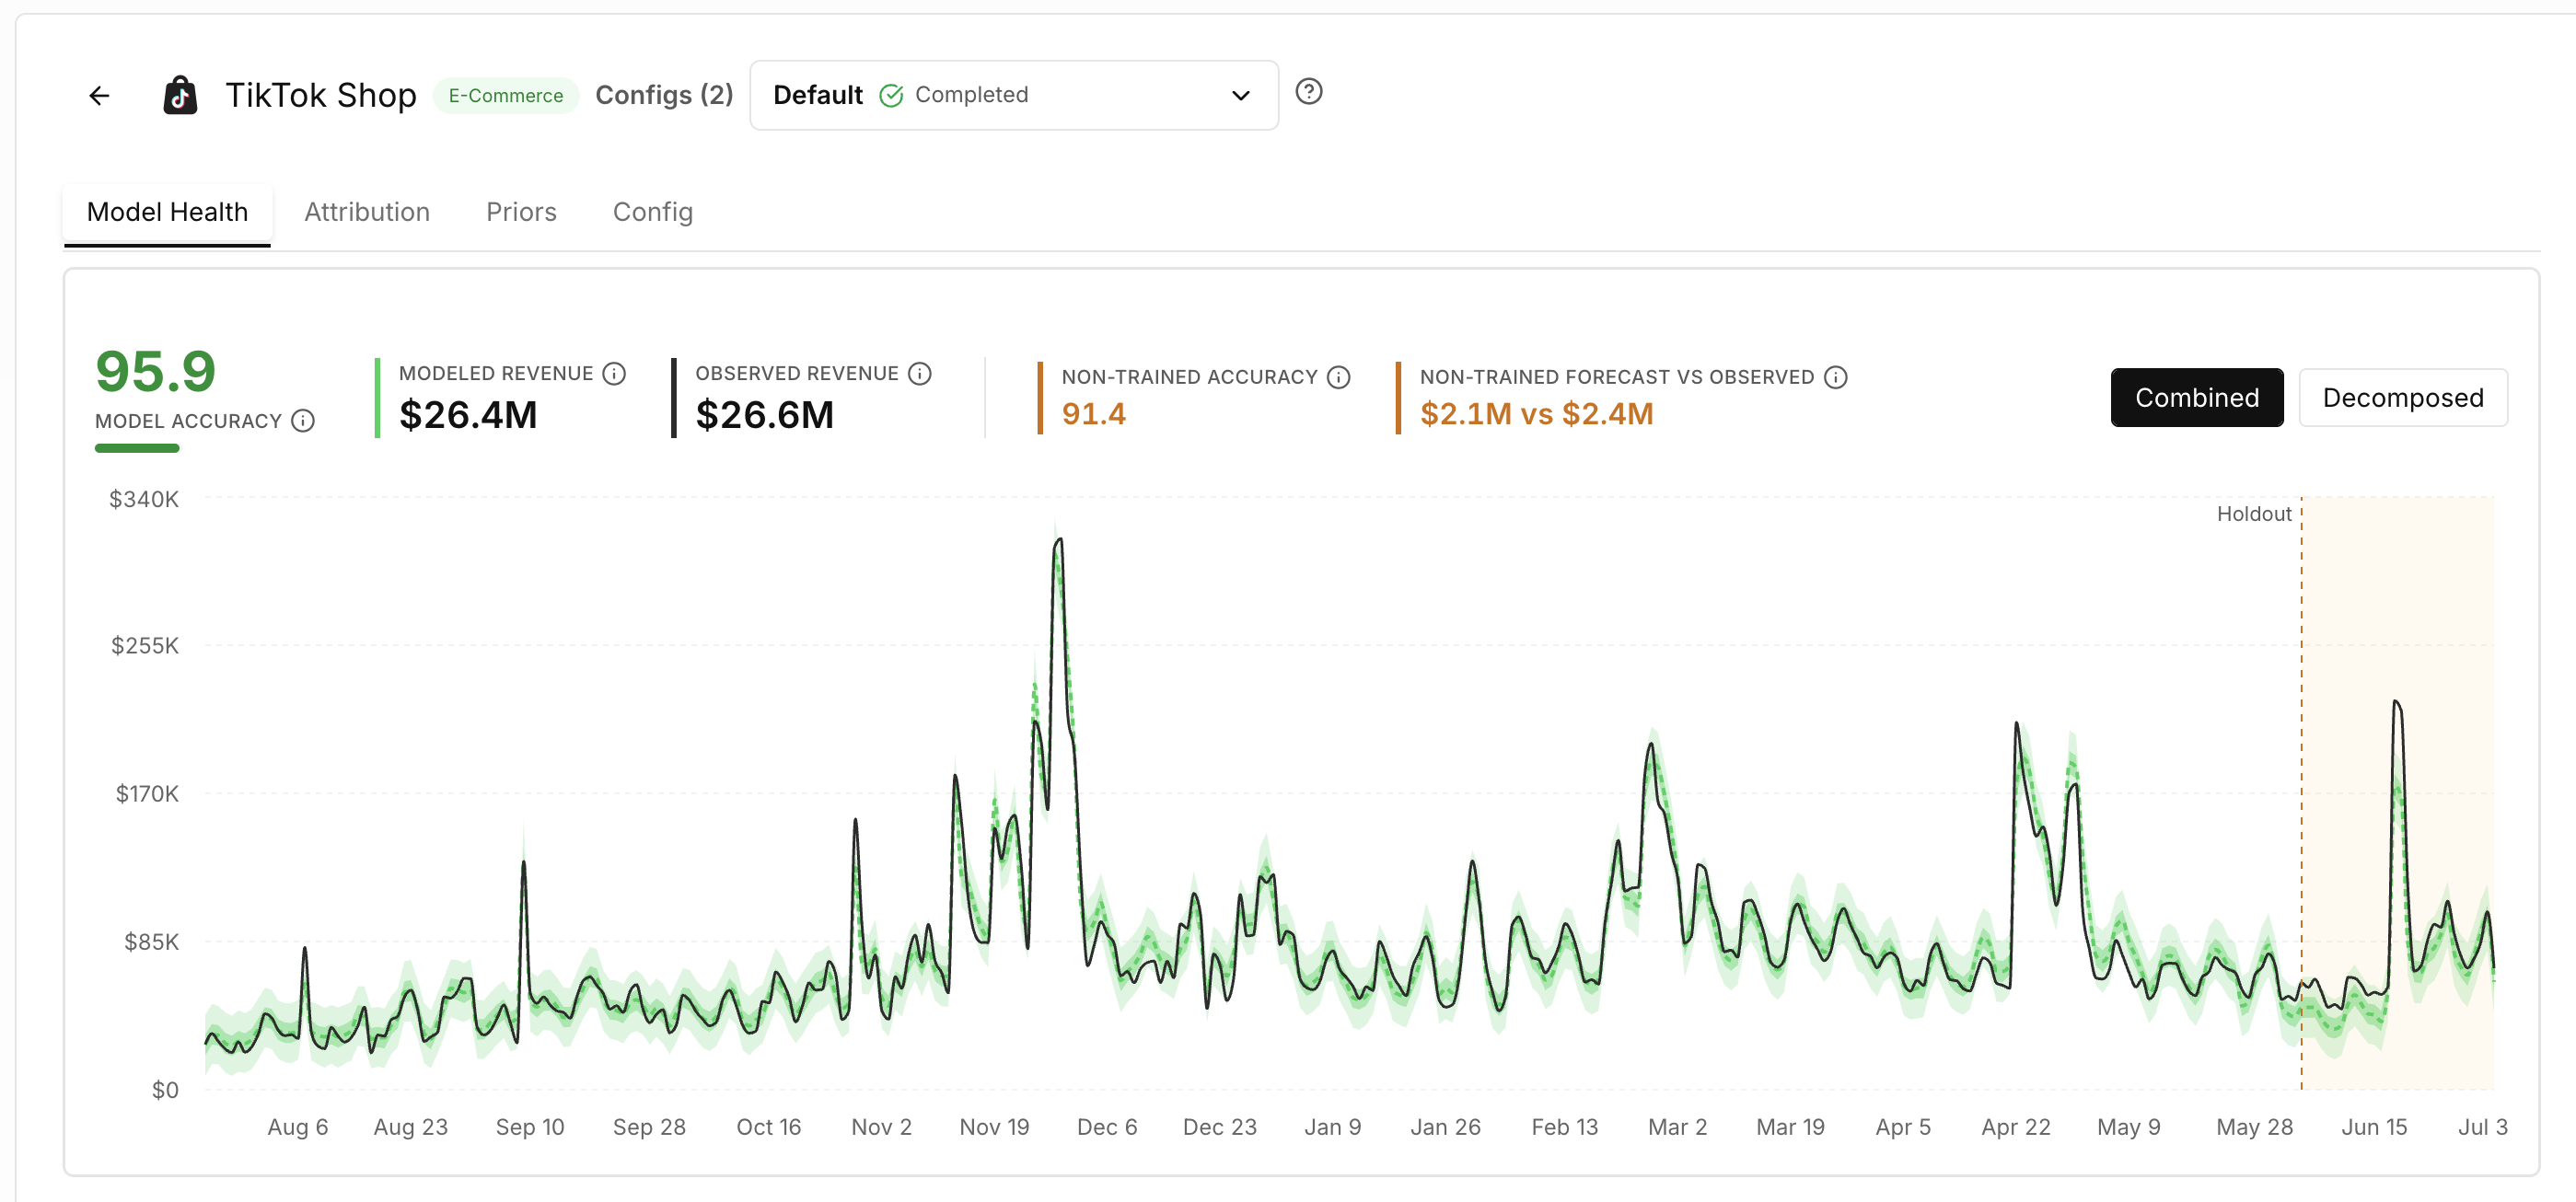
You can review:
- Model accuracy
- Modeled versus observed results
- Non-trained forecast accuracy
- Forecast versus observed performance
- The historical performance chart
The non-trained period shows how the model performed on data that was not used during training. This provides an additional test of the model’s ability to forecast unfamiliar data.
→Combined and Decomposed Views
Use Combined to compare total modeled and observed performance.
Use Decomposed to explore the components contributing to the model, including media and non-media effects.
The Business Context section helps explain factors such as:
- Promotions
- Events
- Holidays
- Seasonality
- Long-term business trends
2. Attribution
The Attribution tab shows how the selected model distributes incremental performance across the media mix.
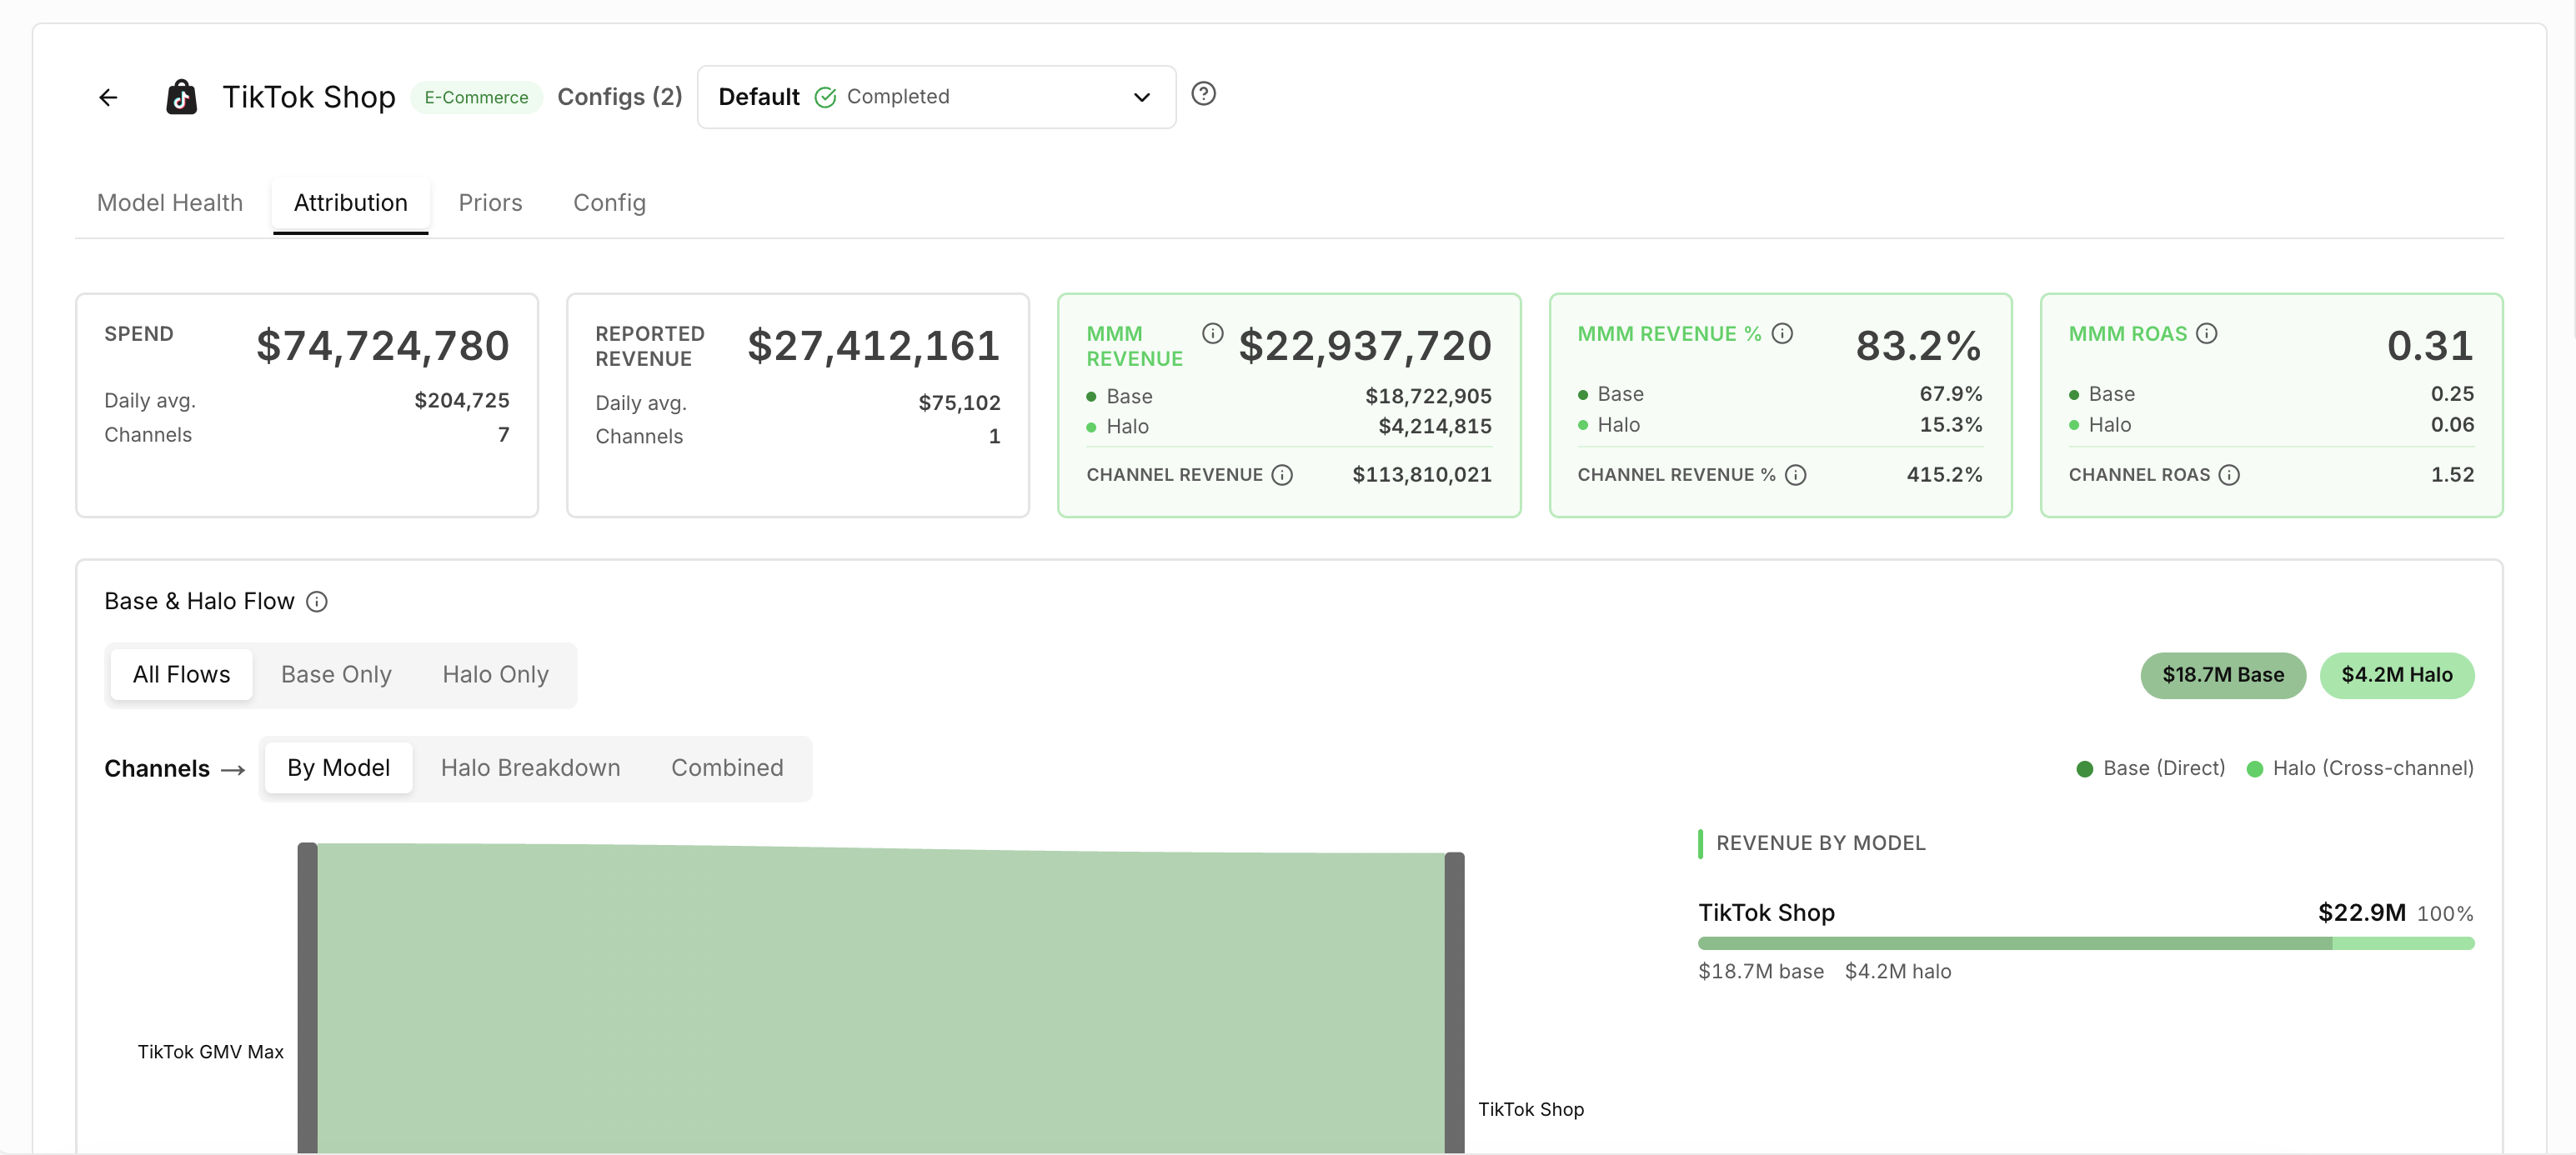
Use it to review whether the results are reasonable before the configuration is used for reporting and forecasting.
Detailed attribution analysis is available in the dedicated Attribution feature. See more
Compare Configurations
A model may contain multiple configurations that use different assumptions or settings.
Select Compare configs to evaluate them together.
When comparing configurations, consider:
- Historical accuracy
- Non-trained forecast performance
- Stability
- Attribution reasonableness
- Business context
- Forecast usefulness
The best configuration is not necessarily the one with the highest single accuracy score. It should provide a reliable and realistic representation of the business that can support future forecasting decisions.
Key Takeaways
- Model Center shows the models powering Prescient’s results.
- Each business outcome can have multiple model configurations.
- The active configuration is used for attribution and forecasting.
- Model accuracy measures alignment between modeled and observed performance.
- Non-trained results help evaluate forecasting performance.
- Priors and configuration settings provide transparency into model construction.
- Multiple signals are considered when choosing the strongest model.
Updated 8 days ago